09-JMH
benchmark 英 [ˈbentʃmɑːk] n. 基准,vt. 检测(用基准问题测试)
harness 英 [ˈhɑːnɪs] n. 马具;挽具;背带,保护带,vt. 控制,利用(以产生能量等)
测试:
- 自动化开发
- 性能开发:JMH
- 测试开发:为测试开发工具
QPS:query_per_seconds
1. what
Java_Microbenchmark_Harness
2. 创建JMH测试
JMHTest
1. 添加依赖
<!-- https://mvnrepository.com/artifact/org.openjdk.jmh/jmh-core -->
<dependency>
    <groupId>org.openjdk.jmh</groupId>
    <artifactId>jmh-core</artifactId>
    <version>1.21</version>
</dependency>
<!-- https://mvnrepository.com/artifact/org.openjdk.jmh/jmh-generator-annprocess -->
<dependency>
    <groupId>org.openjdk.jmh</groupId>
    <artifactId>jmh-generator-annprocess</artifactId>
    <version>1.21</version>
    <scope>test</scope>
</dependency>
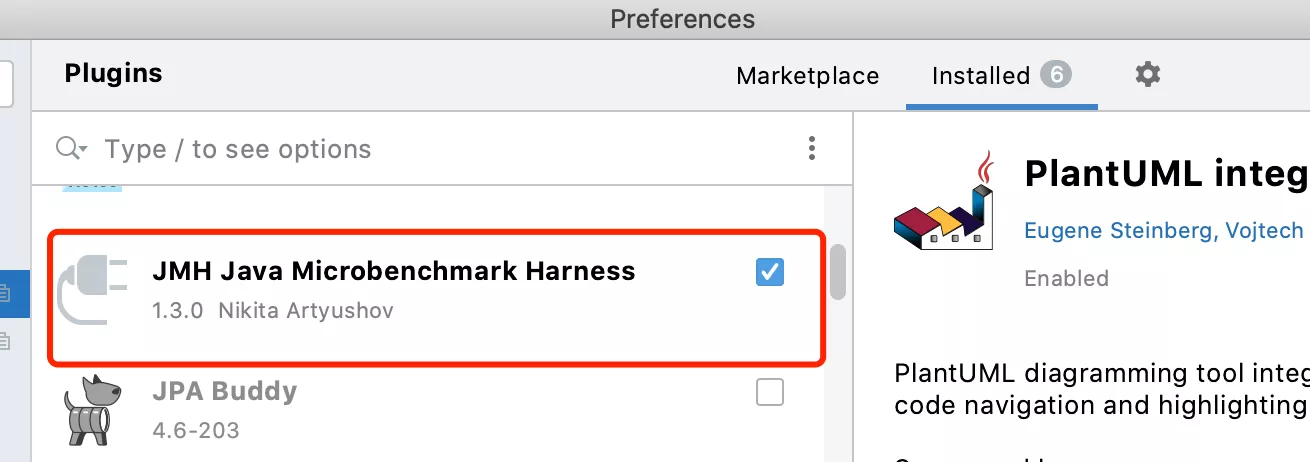
2. JMH插件
《 JMH Java Microbenchmark Harness》
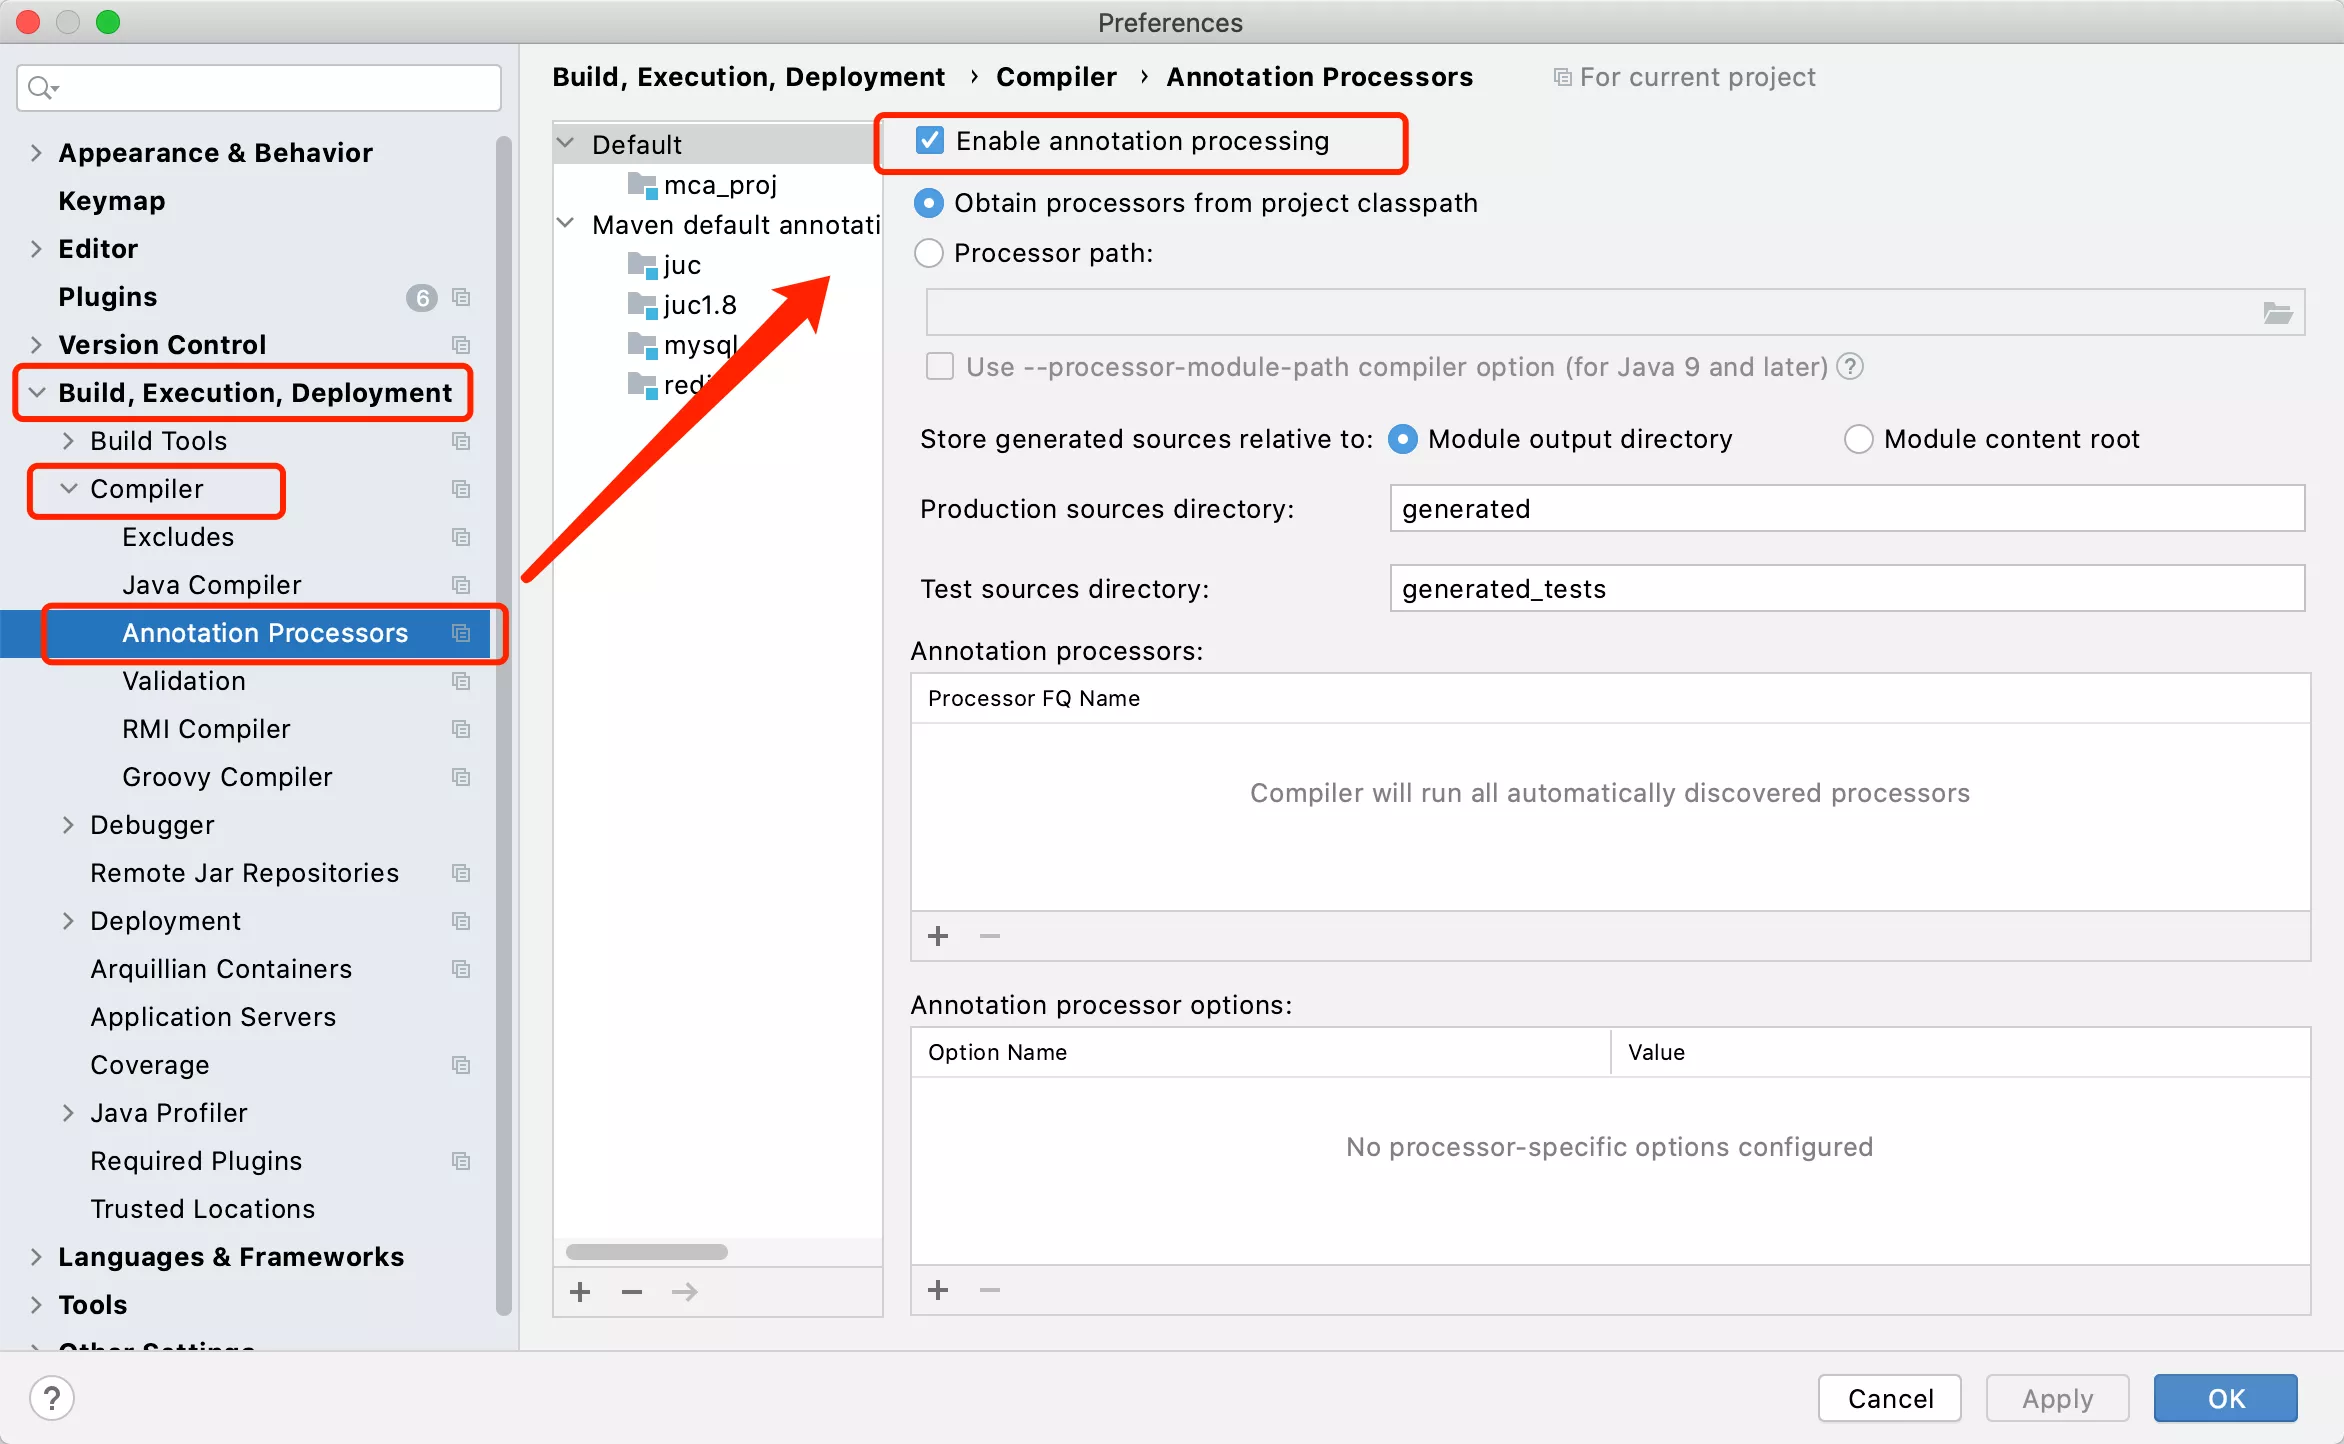
3. 打开注解配置
setting => compiler => Annotation Processors => Enable annotation processing
4. 单元测试
这个测试类一定要在test package下面
/**
 * 不能用debug模式,用run即可
 */
public class JMHTest {

    // Benchmark:默认注解执行的时间很长,10分钟左右
    @Benchmark
    // 预热:迭代一次,3s
    // JVM中对于特定代码会存在优化(本地化),预热对于测试结果很重要
    @Warmup(iterations = 1, time = 3)
    // thread量
    @Fork(5)
    // 模式,吞吐量:1. 1秒n次 2. 1次n秒
    @BenchmarkMode(Mode.Throughput)
    // 方法调用次数
    @Measurement(iterations = 1, time = 3)
    public void testForEach() {
        JMH.parallel();
        // JMH.parallel();
    }
}

class JMH {

    static List<Integer> nums = new ArrayList<>();

    static {
        Random r = new Random();
        for (int i = 0; i < 1_000; i++) nums.add(1_000_000 + r.nextInt(1_000_000));
    }

    public static void foreach() {
        nums.forEach(JMH::isPrime);
    }

    static void parallel() {
        nums.parallelStream().forEach(JMH::isPrime);
    }

    static void isPrime(int num) {
        for (int i = 2; i <= num / 2; i++) {
            if (num % i == 0) return;
        }
    }
}
5. 运行测试类
如果遇到下面的错误:
ERROR: org.openjdk.jmh.runner.RunnerException: ERROR: Exception while trying to acquire the JMH lock (C:\WINDOWS\/jmh.lock): C:\WINDOWS\jmh.lock (拒绝访问。), exiting. Use -Djmh.ignoreLock=true to forcefully continue.
	at org.openjdk.jmh.runner.Runner.run(Runner.java:216)
	at org.openjdk.jmh.Main.main(Main.java:71)
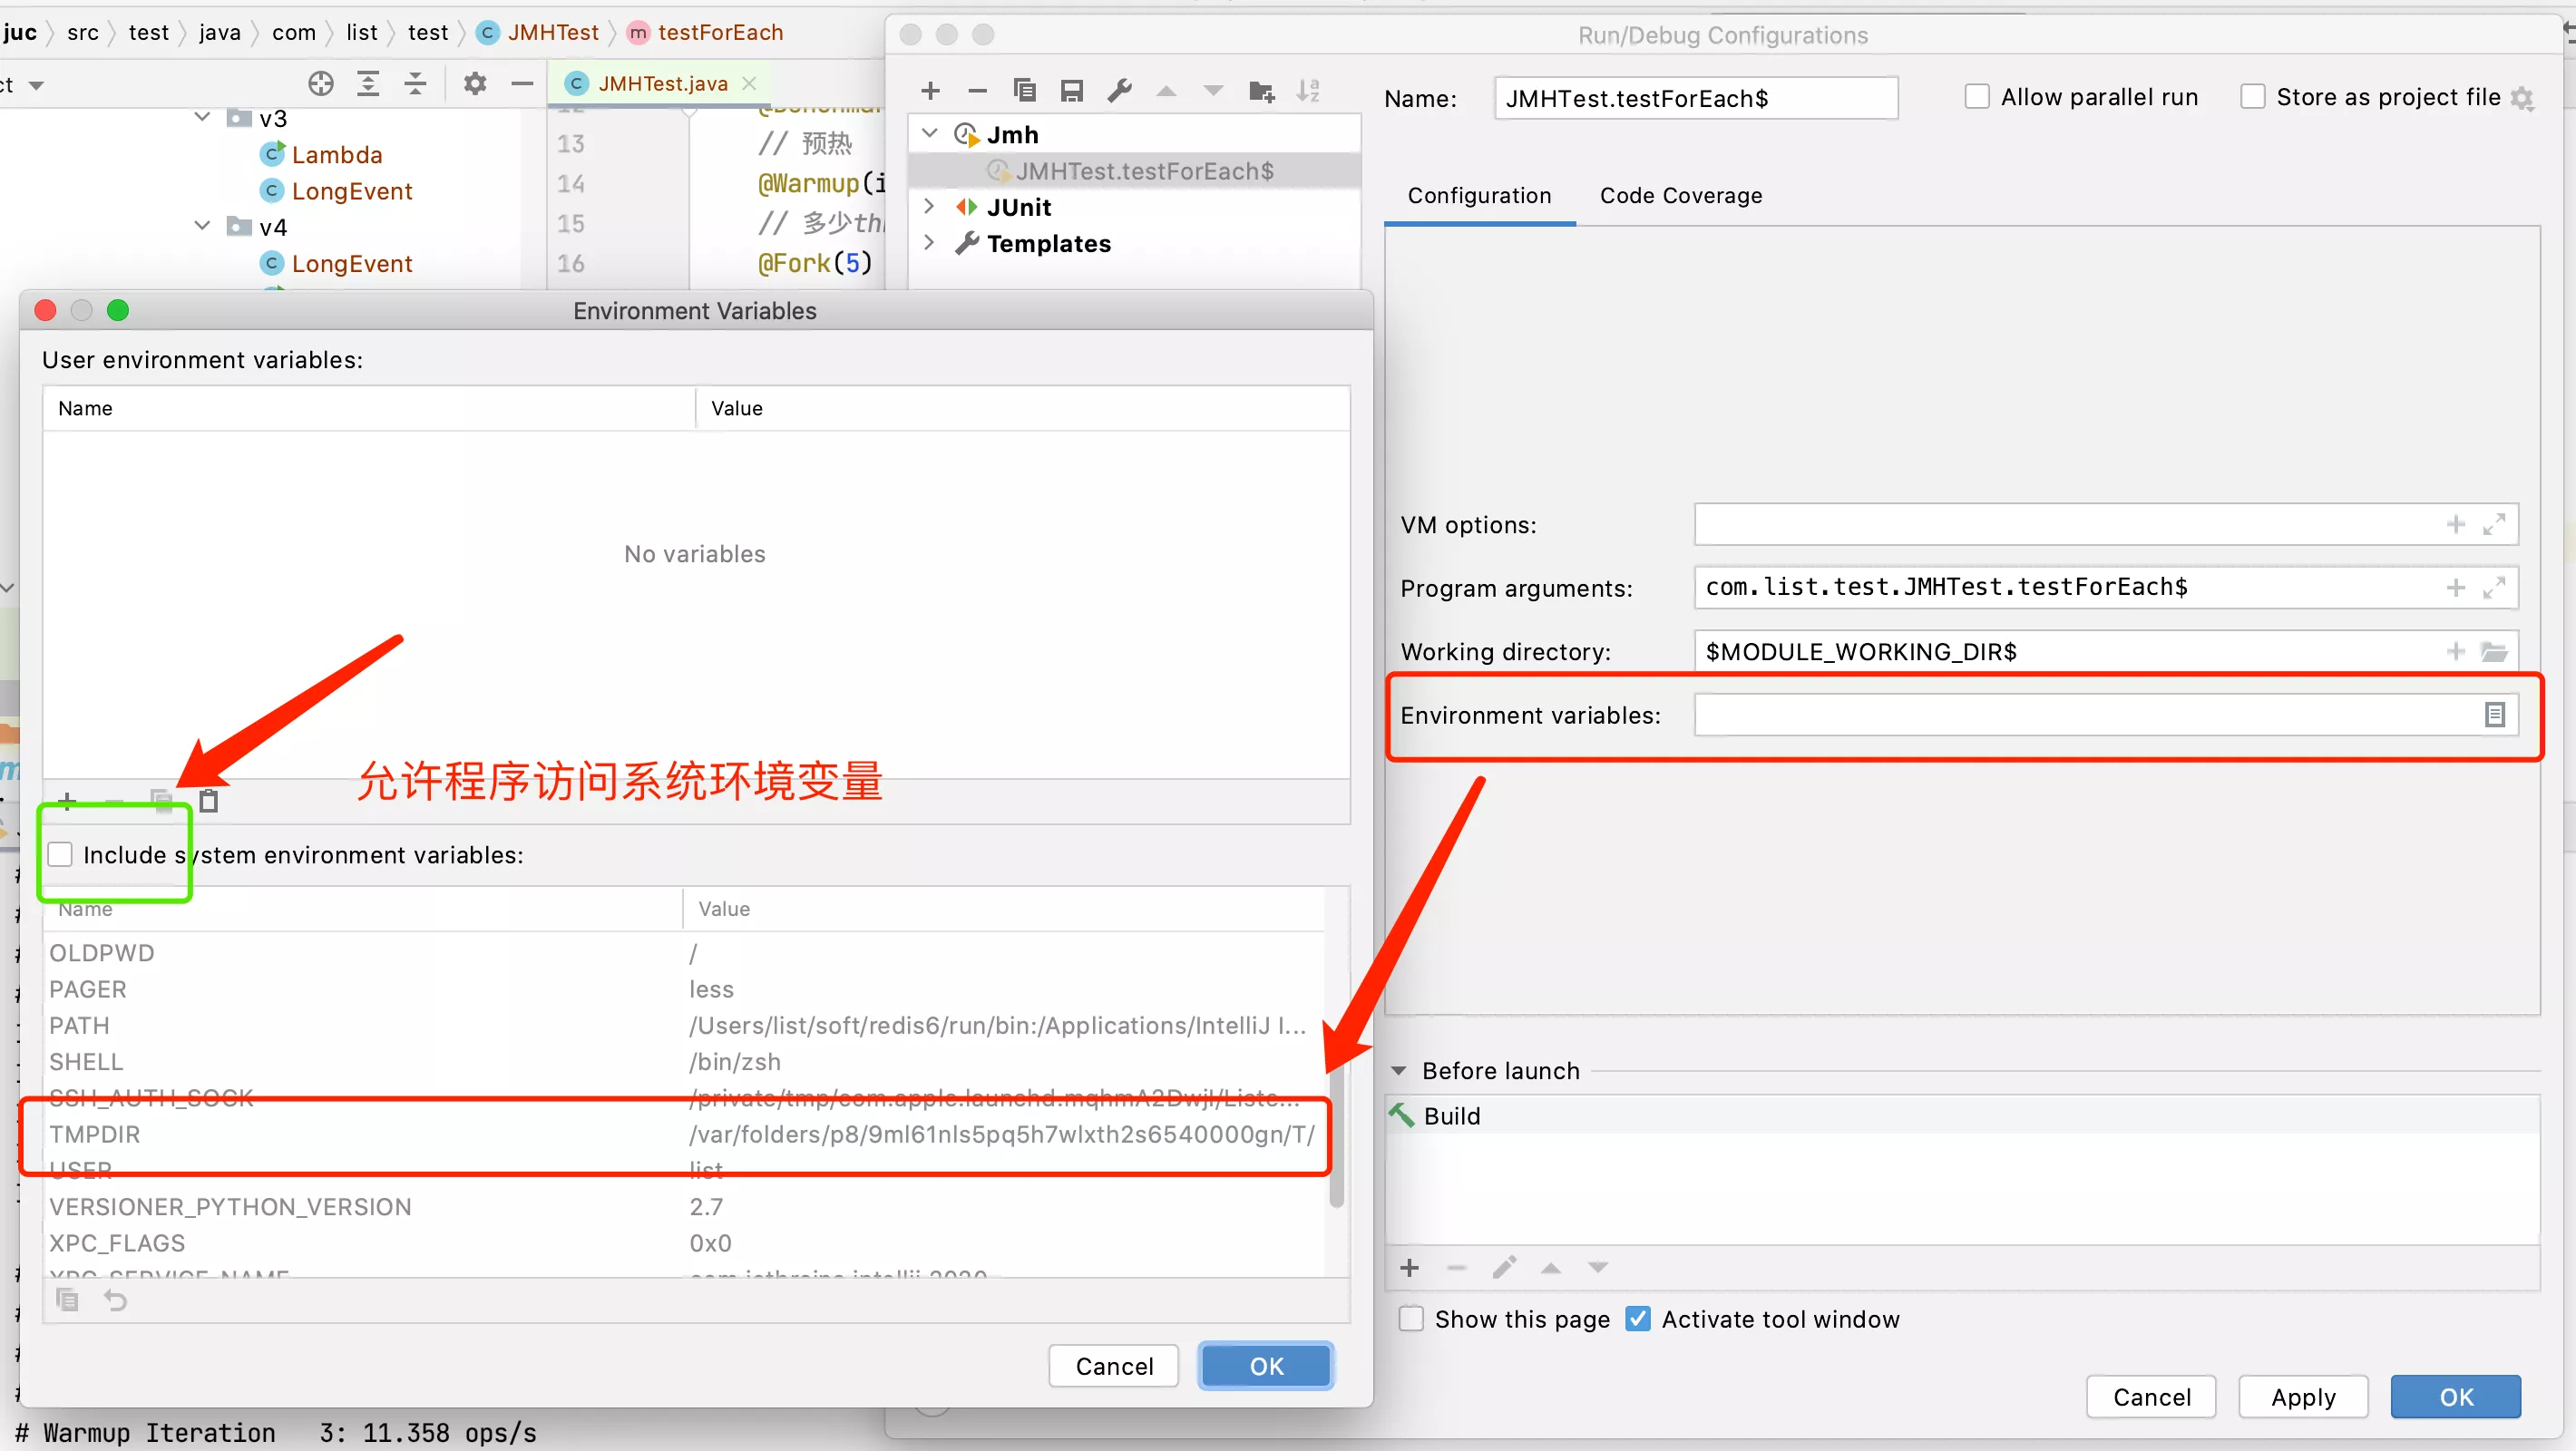
这个错误是因为JMH运行需要访问系统的TMP目录,更改TMP目录。解决办法是:
RunConfiguration => Environment Variables => include system environment viables
6. 运行日志
JMH.foreach();
# JMH version: 1.21
# VM version: JDK 11.0.16, OpenJDK 64-Bit Server VM, 11.0.16+8-LTS
# VM invoker: /Users/list/Library/Java/JavaVirtualMachines/corretto-11.0.16/Contents/Home/bin/java
# VM options: -javaagent:/Applications/IntelliJ IDEA.app/Contents/lib/idea_rt.jar=56426:/Applications/IntelliJ IDEA.app/Contents/bin -Dfile.encoding=UTF-8
# Warmup: 1 iterations, 3 s each
# Measurement: 1 iterations, 3 s each
# Timeout: 10 min per iteration
# Threads: 1 thread, will synchronize iterations
# Benchmark mode: Throughput, ops/time
# Benchmark: com.list.test.JMHTest.testForEach

# Run progress: 0.00% complete, ETA 00:00:30
# Fork: 1 of 5
# Warmup Iteration   1: 8.843 ops/s
Iteration   1: 9.936 ops/s

# Run progress: 20.00% complete, ETA 00:00:27
# Fork: 2 of 5
# Warmup Iteration   1: 8.681 ops/s
Iteration   1: 8.791 ops/s

# Run progress: 40.00% complete, ETA 00:00:20
# Fork: 3 of 5
# Warmup Iteration   1: 9.971 ops/s
Iteration   1: 9.806 ops/s

# Run progress: 60.00% complete, ETA 00:00:13
# Fork: 4 of 5
# Warmup Iteration   1: 11.123 ops/s
Iteration   1: 11.070 ops/s

# Run progress: 80.00% complete, ETA 00:00:06
# Fork: 5 of 5
# Warmup Iteration   1: 10.568 ops/s
Iteration   1: 10.709 ops/s


Result "com.list.test.JMHTest.testForEach":
  10.062 ±(99.9%) 3.407 ops/s [Average]
  (min, avg, max) = (8.791, 10.062, 11.070), stdev = 0.885
  CI (99.9%): [6.655, 13.470] (assumes normal distribution)


# Run complete. Total time: 00:00:33

REMEMBER: The numbers below are just data. To gain reusable insights, you need to follow up on
why the numbers are the way they are. Use profilers (see -prof, -lprof), design factorial
experiments, perform baseline and negative tests that provide experimental control, make sure
the benchmarking environment is safe on JVM/OS/HW level, ask for reviews from the domain experts.
Do not assume the numbers tell you what you want them to tell.

Benchmark             Mode  Cnt   Score   Error  Units
JMHTest.testForEach  thrpt    5  10.062 ± 3.407  ops/s
JMH.parallel();
# JMH version: 1.21
# VM version: JDK 11.0.16, OpenJDK 64-Bit Server VM, 11.0.16+8-LTS
# VM invoker: /Users/list/Library/Java/JavaVirtualMachines/corretto-11.0.16/Contents/Home/bin/java
# VM options: -javaagent:/Applications/IntelliJ IDEA.app/Contents/lib/idea_rt.jar=56493:/Applications/IntelliJ IDEA.app/Contents/bin -Dfile.encoding=UTF-8
# Warmup: 1 iterations, 3 s each
# Measurement: 1 iterations, 3 s each
# Timeout: 10 min per iteration
# Threads: 1 thread, will synchronize iterations
# Benchmark mode: Throughput, ops/time
# Benchmark: com.list.test.JMHTest.testForEach

# Run progress: 0.00% complete, ETA 00:00:30
# Fork: 1 of 5
# Warmup Iteration   1: 36.398 ops/s
Iteration   1: 42.182 ops/s

# Run progress: 20.00% complete, ETA 00:00:27
# Fork: 2 of 5
# Warmup Iteration   1: 50.741 ops/s
Iteration   1: 52.327 ops/s

# Run progress: 40.00% complete, ETA 00:00:20
# Fork: 3 of 5
# Warmup Iteration   1: 41.879 ops/s
Iteration   1: 38.045 ops/s

# Run progress: 60.00% complete, ETA 00:00:13
# Fork: 4 of 5
# Warmup Iteration   1: 46.885 ops/s
Iteration   1: 44.649 ops/s

# Run progress: 80.00% complete, ETA 00:00:06
# Fork: 5 of 5
# Warmup Iteration   1: 50.807 ops/s
Iteration   1: 57.188 ops/s


Result "com.list.test.JMHTest.testForEach":
  46.878 ±(99.9%) 29.890 ops/s [Average]
  (min, avg, max) = (38.045, 46.878, 57.188), stdev = 7.762
  CI (99.9%): [16.988, 76.768] (assumes normal distribution)


# Run complete. Total time: 00:00:33

REMEMBER: The numbers below are just data. To gain reusable insights, you need to follow up on
why the numbers are the way they are. Use profilers (see -prof, -lprof), design factorial
experiments, perform baseline and negative tests that provide experimental control, make sure
the benchmarking environment is safe on JVM/OS/HW level, ask for reviews from the domain experts.
Do not assume the numbers tell you what you want them to tell.

Benchmark             Mode  Cnt   Score    Error  Units
JMHTest.testForEach  thrpt    5  46.878 ± 29.890  ops/s