08-JVM_Tool
histogram 英 [ˈhɪstəɡræm] n. [统计] 直方图;柱状图
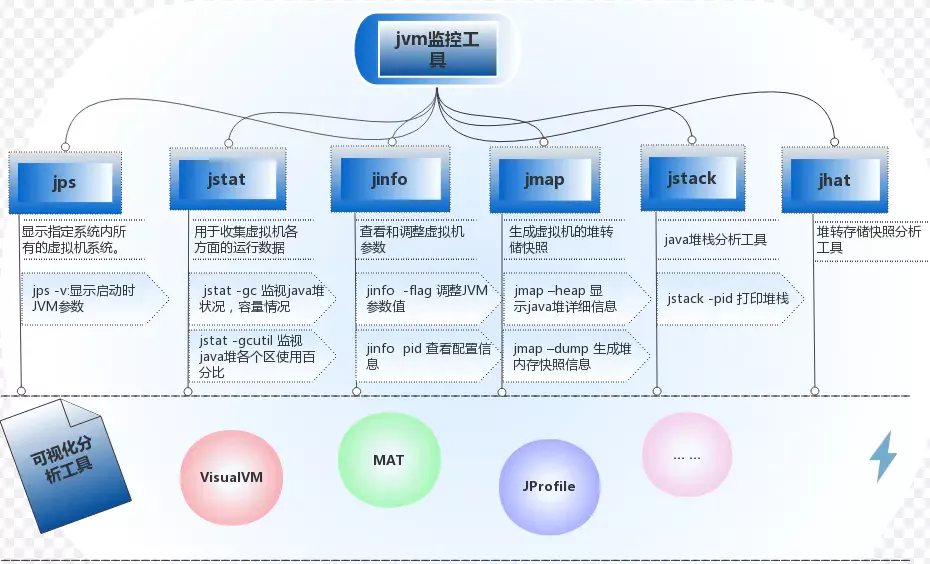
1. 性能监控和故障处理工具
| 名称 | 主要作用 |
|---|---|
| jps | JVM Process Status Tool,显示指定系统内所有的 HotSpot 虚拟机进程 |
| jstat | JVM Statistics Monitoring Tool,用于收集 Hotspot 虚拟机各方面的运行数据 |
| jstatd | JVM Statistics Monitoring Tool Daemon,jstat的守护程序,启动一个RMI服务器应用程序,用于监视测试的 HotSpot 虚拟机的创建和终止,并提供一个界面,允许远程监控工具附加到在本地系统上运行的虚拟机。在JDK9中集成到了 JHSDB中 |
| jinfo | Configuration Info for Java,显示虚拟机配置信息。在 JDK 9中集成到了 JHSDB 中 |
| jmap | Memory Map for Java,生成虚拟机的内存转储快照(heapdump 文件)。在 JDK 9 中集成到了JHSDB中 |
| jhat | JVM Heap Analysis Tool,用于分析堆转储快照,它会建立一个 HTTP/Web 服务器,让用户可以在浏览器上查看分析结果。在 JDK9中被 JHSDB 代替 |
| jstack | Stack Trace for Java,显示虚拟机的线程快照。在 JDK9中集成到了 JHSDB中 |
| jhsdb | Java HotSpot Debugger,一个基于 Serviceability Agent的HotSpot进程调试器,从 JDK9 开始提供 |
| jsadebugd | Java Serviceability Agent Debug Daemon,适用于 Java 的可维护性代理调试守护程序,主要用于附加到指定的 Java 进程、核心文件,或充当一个调试服务器 |
| icmd | JVM Command,虚拟机诊断命令工具,将诊断命令请求发送到正在运行的 Java 虚拟机。从JDK7开始提供 |
| jconsole | Java Console,用于监控 Java 虚拟机的使用 JMX 规范的图形工具。它可以监控本地和远程Java虚拟机,还可以监控和管理应用程序 |
| jmc | Java Mission Control,包含用于监控和管理 Java 应用程序的工具,而不会引人与这些工具相关联的性能开销。开发者可以使用 jmc 命令来创建 JMC 工具,从 JDK 7 Update 40 开始集成到OracleJDK中 |
| jvisualvm | Java VisualVM,一种图形化工具,可在 Java 虚拟机中运行时提供有关基于 Java技术的应用程序(Java 应用程序)的详细信息。Java VisualVM 提供内存和 CPU 分析、堆转储分析、内存泄漏检测、MBean 访问和垃圾收集。从 JDK6 Update 7开始提供;从JDK9开始不再打包入 JDK中,但仍保持更新发展,可以独立下载 |
2. JCMD、JHSDB和基础工具对比
| 基础工具 | JCMD | JHSDB |
|---|---|---|
| jps -lm | jcmd | N/A |
| jmap -dump <pid> | jcmd <pid> GC.heap dump | jhsdb jmap --binaryheap |
| jmap -histo <pid> | jcmd <pid> GC.class histogram | jhsdb jmap --histo |
| jstack <pid> | jcmd <pid> Thrad.print | jhsdb istack --locks |
| jinfo -sysprops <pid> | jcmd <pid>VM.system properties | jhsdb info --sysprops |
| jinfo -flags <pid> | jcmd <pid> VM.flags | jhsdb jinfo --flags |
3. 运行测试程序
➜  classes git:(master) ✗# java -Xms200M -Xmx200M -XX:+PrintGC com.listao.jvm.c5_gc.T06_FullGC_Problem
[GC (Allocation Failure)  51712K->1288K(196608K), 0.0013372 secs]
/**
 * 从数据库中读取信用数据,套用模型,并把结果进行记录和传输
 */
public class T06_FullGC_Problem {

    private static class CardInfo {
        BigDecimal price = new BigDecimal(0.0);
        String name = "张三";
        int age = 5;
        Date birthdate = new Date();

        public void m() {
        }
    }

    private static ScheduledThreadPoolExecutor executor = new ScheduledThreadPoolExecutor(50,
            new ThreadPoolExecutor.DiscardOldestPolicy());

    /**
     * 跑一段时间日志也显示
     */
    public static void main(String[] args) throws Exception {
        executor.setMaximumPoolSize(50);
        for (; ; ) {
            modelFit();
            Thread.sleep(100);
        }
    }

    private static void modelFit() {
        List<CardInfo> taskList = getAllCardInfo();
        taskList.forEach(info -> {
            // do something
            executor.scheduleWithFixedDelay(() -> {
                // do sth with info
                info.m();

            }, 2, 3, TimeUnit.SECONDS);
        });
    }

    private static List<CardInfo> getAllCardInfo() {
        List<CardInfo> taskList = new ArrayList<>();
        for (int i = 0; i < 100; i++) {
            CardInfo ci = new CardInfo();
            taskList.add(ci);
        }
        return taskList;
    }
}
1. 运维团队收到报警信息
- CPU Memory
- ansiable(自动化运维工具)
4. cmd
常用命令
# 查看JVM进程
jps -lv

# 查看JVM进程heap详情
jmap -heap 1436

# 查看jvm线程运行状态,是否有死锁现象等等信息
Jstack [pid]

# 一个极强的监视VM内存工具。监视VM内存内的各种堆和非堆的大小及其内存使用量
jstat

# 查看线程总数
pstreee -p pid | wc -l
1. top
观察到问题:内存不断增长,CPU占用率居高不下
top
top - 10:11:55 up 9 days, 18:37,  2 users,  load average: 0.34, 0.24, 0.18
Tasks: 254 total,   1 running, 253 sleeping,   0 stopped,   0 zombie
%Cpu(s):  2.3 us,  0.6 sy,  0.0 ni, 97.2 id,  0.0 wa,  0.0 hi,  0.0 si,  0.0 st
KiB Mem : 15961024 total,  4024340 free,  8654168 used,  3282516 buff/cache
KiB Swap:  8126460 total,  8070908 free,    55552 used.  6576792 avail Mem

  PID USER      PR  NI    VIRT    RES    SHR S  %CPU %MEM     TIME+ COMMAND
25015 chrony    20   0 2658136 992908  12288 S   7.7  6.2 721:04.88 bundle
23713 root      20   0 4082556 413748  13904 S   1.7  2.6  48:53.67 java
24824 997       20   0   70716  12500   2780 S   1.0  0.1 125:14.00 redis-server
13753 root      20   0 4695752 782808  16560 S   0.7  4.9  49:43.81 java
14262 root      20   0 3689676 247428  13036 S   0.7  1.6 185:49.22 java
    9 root      20   0       0      0      0 S   0.3  0.0   8:27.23 rcu_sched
 3633 root      20   0 7757500 247028   8256 S   0.3  1.5  12:29.23 java
12547 root      20   0  162144   2464   1596 R   0.3  0.0   0:00.07 top
24617 alserver  20   0 7839260   1.1g  12896 S   0.3  7.0  20:37.49 java
25167 chrony    20   0 2218648   1.0g   9792 S   0.3  6.9  39:13.20 bundle
    1 root      20   0  193692   4916   3104 S   0.0  0.0   0:27.29 systemd
2. top -Hp <pid>
观察哪个线程CPU、内存占比高
top -Hp 25015
top - 10:15:40 up 9 days, 18:40,  2 users,  load average: 0.40, 0.33, 0.23
Threads:  39 total,   0 running,  39 sleeping,   0 stopped,   0 zombie
%Cpu(s):  4.5 us,  0.9 sy,  0.0 ni, 94.5 id,  0.0 wa,  0.0 hi,  0.1 si,  0.0 st
KiB Mem : 15961024 total,  3997152 free,  8677312 used,  3286560 buff/cache
KiB Swap:  8126460 total,  8070908 free,    55552 used.  6553716 avail Mem

  PID USER      PR  NI    VIRT    RES    SHR S %CPU %MEM     TIME+ COMMAND
25288 chrony    20   0 2658136 979.9m  12288 S  5.3  6.3 409:26.54 scheduler
 9707 chrony    20   0 2658136 979.9m  12288 S  0.7  6.3   0:50.05 processor
 2339 chrony    20   0 2658136 979.9m  12288 S  0.3  6.3  14:18.26 processor
 4297 chrony    20   0 2658136 979.9m  12288 S  0.3  6.3   0:57.57 processor
 4304 chrony    20   0 2658136 979.9m  12288 S  0.3  6.3   0:54.91 processor
25015 chrony    20   0 2658136 979.9m  12288 S  0.0  6.3   0:38.10 bundle
25099 chrony    20   0 2658136 979.9m  12288 S  0.0  6.3   0:02.79 connection_poo*
25103 chrony    20   0 2658136 979.9m  12288 S  0.0  6.3   0:15.20 ruby_sampler
25104 chrony    20   0 2658136 979.9m  12288 S  0.0  6.3   0:57.55 threads_sampler
25105 chrony    20   0 2658136 979.9m  12288 S  0.0  6.3   0:50.20 database_sample
25106 chrony    20   0 2658136 979.9m  12288 S  0.0  6.3   1:37.18 background_task
25121 chrony    20   0 2658136 979.9m  12288 S  0.0  6.3   0:25.30 base_reliable_*
25123 chrony    20   0 2658136 979.9m  12288 S  0.0  6.3   0:09.53 sidekiq_cluste*
25265 chrony    20   0 2658136 979.9m  12288 S  0.0  6.3   0:00.00 server
25266 chrony    20   0 2658136 979.9m  12288 S  0.0  6.3   6:43.20 heartbeat
25267 chrony    20   0 2658136 979.9m  12288 S  0.0  6.3   4:29.24 scheduler
25308 chrony    20   0 2658136 979.9m  12288 S  0.0  6.3   0:00.00 default-executo
25309 chrony    20   0 2658136 979.9m  12288 S  0.0  6.3   0:00.00 resolver-execut
25310 chrony    20   0 2658136 979.9m  12288 S  0.0  6.3   0:57.83 grpc_global_tim
25311 chrony    20   0 2658136 979.9m  12288 S  0.0  6.3   0:00.00 processor
25312 chrony    20   0 2658136 979.9m  12288 S  0.0  6.3   0:00.44 processor
3. jps
java ps,显示Java进程
[root@bogon tmp]# jps
23713 listao-gateway-server-1.11.0-SNAPSHOT.jar
12833 Jps
14262 listao-boon-server-1.0.1-RELEASE.jar
13753 nacos-server.jar
4. jstack <pid>
jstack 定位线程状况,重点关注:WAITING BLOCKED
- 假如一个进程中100个线程,很多线程都在waiting on
<xx>,怎么找到哪个线程持有这把锁?- 搜索jstack dump的信息,找
<xx>,看哪个线程持有这把锁RUNNABLE
- 搜索jstack dump的信息,找
- 写一个死锁程序,用jstack观察
- 写一个程序,一个线程持有锁不释放,其他线程等待
1. 阿里规范
线程的名称(尤其是线程池)有意义。怎么样自定义线程池里的线程名称?(自定义ThreadFactory)
5. jinfo <pid>
进程JVM的详细信息展示
6. jstat -gc
提示太不直观
jstat -gc <pid> 500:每500ms打印GC情况
7. jmap
1. histo
jmap -histo <pid> | head -20:查询Heap里Obj情况
查找有多少Obj产生,命令对线上系统影响不高
# 查看Heap中对象的占用空间情况
[root@bogon tmp]# jmap -histo 14262 | head -20

 num     #instances         #bytes  class name
----------------------------------------------
   1:         83035       16835272  [C
   2:          4692        9532808  [I
   3:         10482        4514728  [B
   4:         64877        1557048  java.lang.String
   5:         18710        1277896  [Ljava.lang.Object;
   6:          8440         945280  org.springframework.boot.loader.jar.JarFile
   7:          8516         875408  java.lang.Class
   8:         24365         779680  java.util.concurrent.ConcurrentHashMap$Node
   9:          8480         679424  [Ljava.util.WeakHashMap$Entry;
  10:         10805         432200  java.util.LinkedHashMap$Entry
  11:          8477         406896  java.util.WeakHashMap
  12:          4879         376224  [Ljava.util.HashMap$Node;
  13:          5669         362816  java.net.URL
  14:          8775         351000  java.lang.ref.Finalizer
  15:          3886         341968  java.lang.reflect.Method
  16:         18949         303184  java.lang.Object
  17:          9137         292384  java.lang.ref.ReferenceQueue
2. dump
堆转储文件,对线上系统影响高
jmap -dump:format=b,file=/Users/listao/temp/temp.dump <pid>
线上系统,内存特别大,jmap执行期间会对进程产生很大影响,甚至卡顿(电商不适合)
- 设定参数HeapDump,OOM时会自动产生堆转储文件
- 很多服务器备份(高可用),停掉这台服务器对其他服务器不影响
- 在线定位(一般小点儿公司用不到)
5. 动态观察gc情况
动态观察gc情况,阅读GC日志发现频繁
- jconsole
- jvisualVM
- Jprofiler(最好用、收费)
- arthas
如果被问是怎么定位OOM问题的? 回答用图形界面(错误),jmx对服务器性能影响挺高的
- 已经上线的系统,不用图形界面用什么?(cmdline arthas)
- 图形界面到底用在什么地方?测试!测试的时候进行监控!(压测观察)
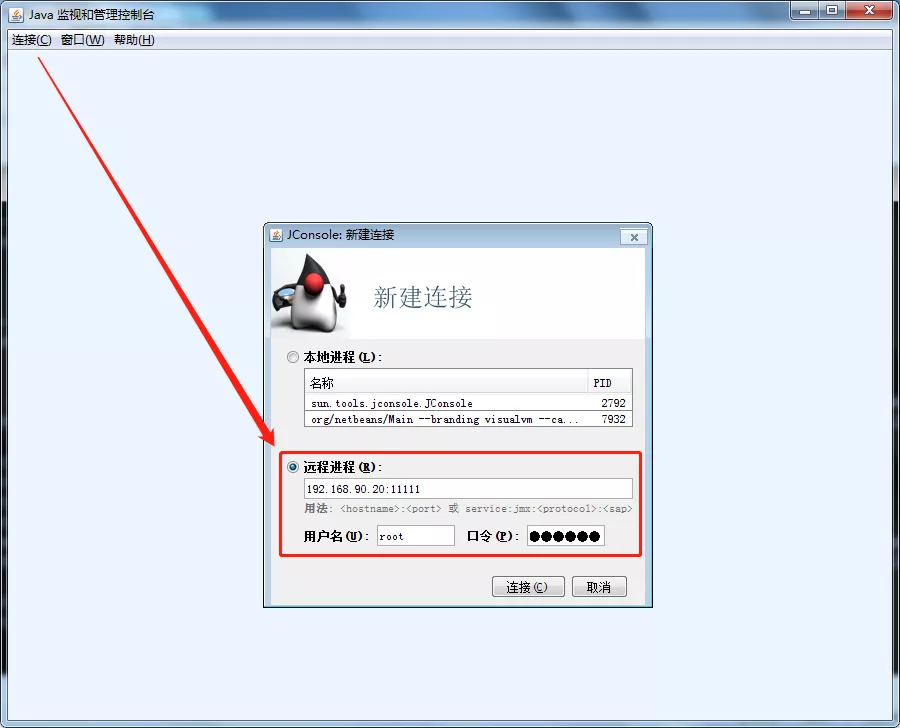
1. jconsole
[root@localhost bin]# pwd
/usr/local/jdk/bin
[root@localhost bin]# ll
# ...
-rwxr-xr-x. 1 10 143   7925 6月  17 2014 jcmd
-rwxr-xr-x. 1 10 143   8013 6月  17 2014 jconsole  # 1. 可视化
-rwxr-xr-x. 1 10 143   6391 6月  17 2014 jcontrol

-rwxr-xr-x. 1 10 143   7941 6月  17 2014 jstatd
-rwxr-xr-x. 1 10 143   5183 9月  11 2013 jvisualvm # 2. 可视化
- 程序启动加入参数,进行远程连接:
FullGC_Problem.tar.gz
[root@bogon tmp]# cd /home/alserver/tmp/
[root@bogon tmp]# ll
总用量 12
-rw-r--r--. 1 root root  202 4月  25 20:26 T06_FullGC_Problem$1.class # 类中包含子类,子类也是个.class
-rw-r--r--. 1 root root  896 4月  25 20:26 T06_FullGC_Problem$CardInfo.class
-rw-r--r--. 1 root root 2942 4月  25 20:26 T06_FullGC_Problem.class
[root@bogon tmp]# java -Djava.rmi.server.hostname=192.168.*.* -Dcom.sun.management.jmxremote -Dcom.sun.management.jmxremote.port=11111 -Dcom.sun.management.jmxremote.authenticate=false -Dcom.sun.management.jmxremote.ssl=false -XX:+PrintGC -Xms200M -Xmx200M T06_FullGC_Problem
[GC (Allocation Failure)  51712K->2024K(196608K), 0.0042256 secs]
[GC (Allocation Failure)  53736K->21142K(196608K), 0.0156253 secs]
[GC (Allocation Failure)  72854K->31797K(196608K), 0.0290640 secs]
[GC (Allocation Failure)  83509K->39888K(196608K), 0.0221658 secs]
[GC (Allocation Failure)  91600K->47168K(195584K), 0.0186104 secs]
[GC (Allocation Failure)  97856K->54160K(167936K), 0.0159233 secs]
[GC (Allocation Failure)  77200K->57552K(182272K), 0.0132713 secs]
- 如果遭遇
Local host name unknown:XXX的错误,修改/etc/hosts文件,把XXX加入进去
192.168.17.11 basic localhost localhost.localdomain localhost4 localhost4.localdomain4
::1 localhost localhost.localdomain localhost6 localhost6.localdomain6
- 关闭linux防火墙(实战中应该打开对应端口)
service iptables stop
chkconfig iptables off # 永久关闭
- windows上打开
jconsole.exe远程连接192.168.17.11:11111
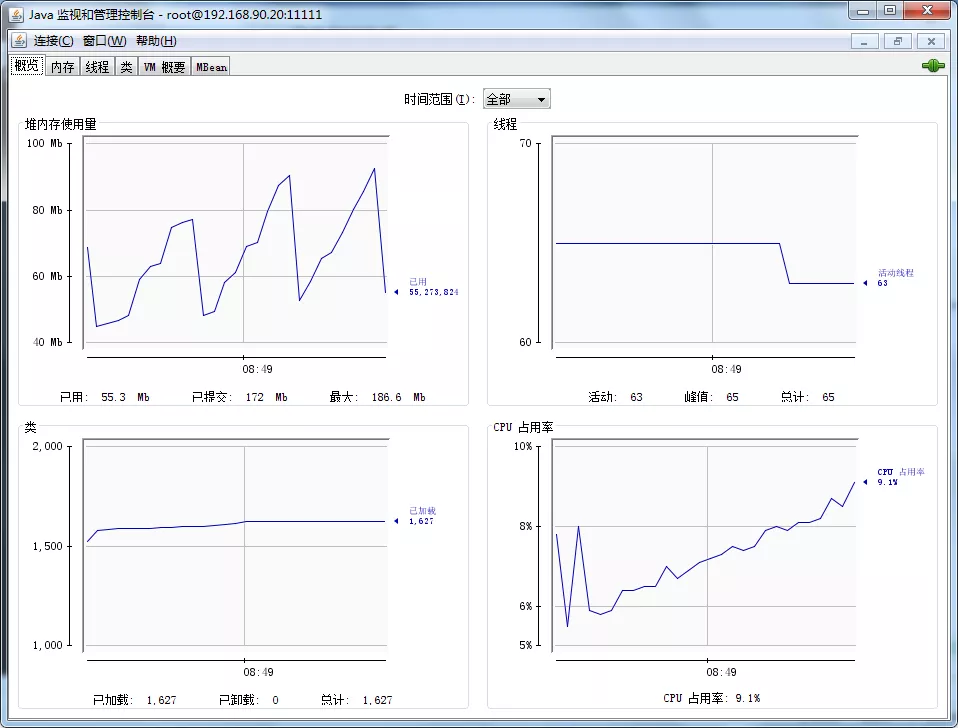
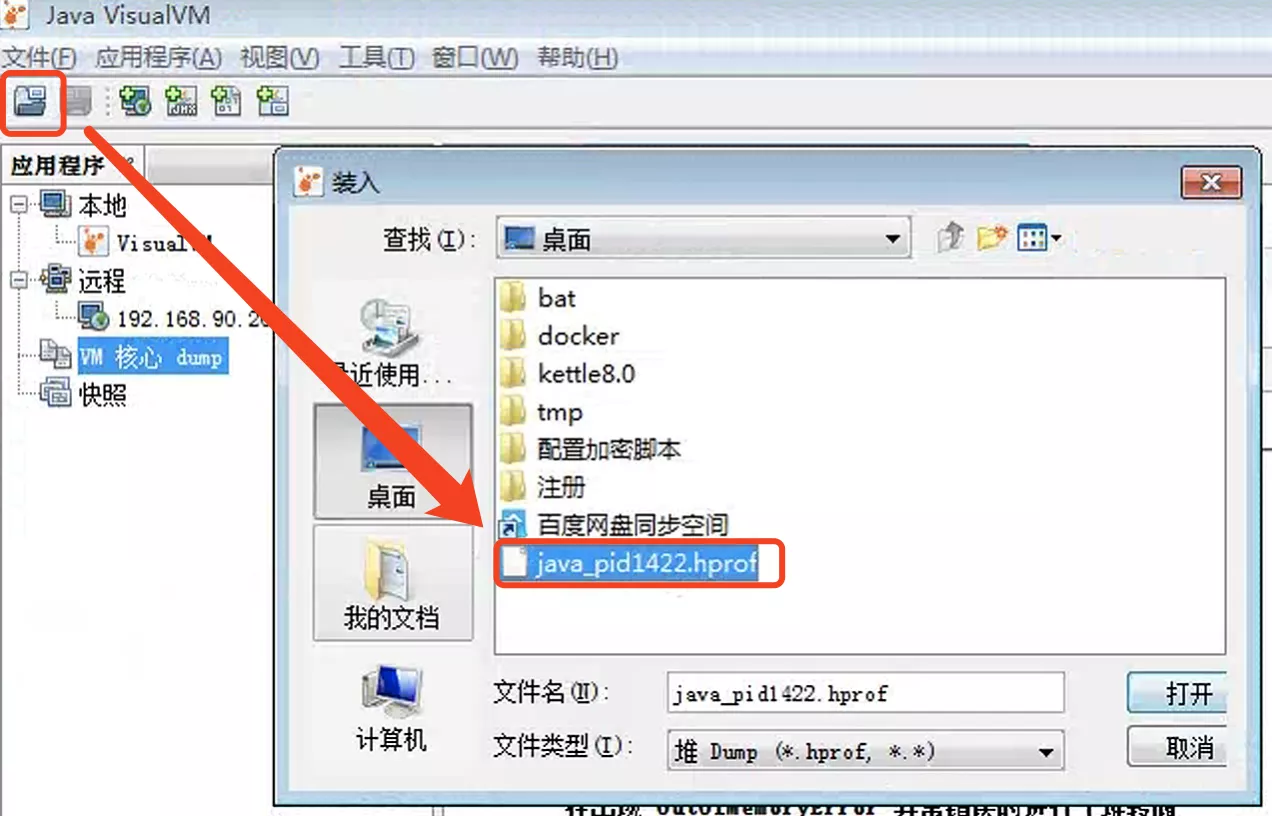
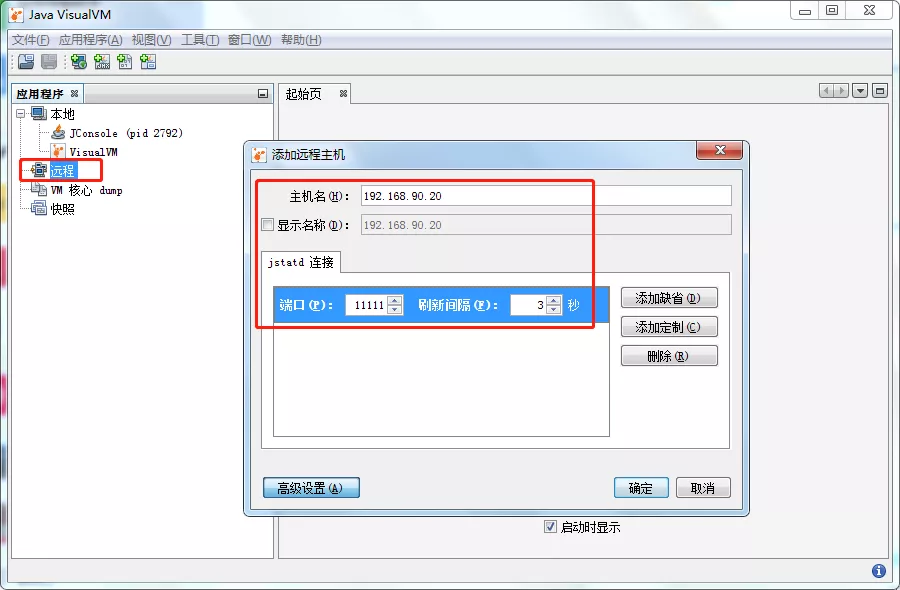
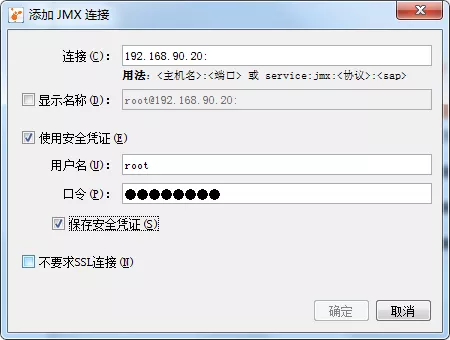
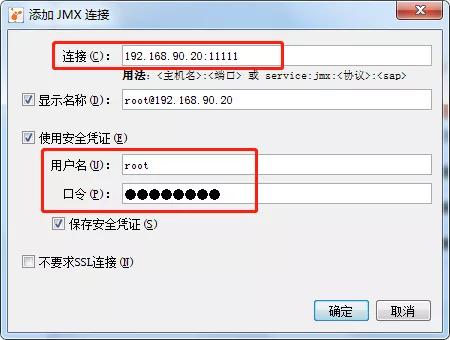
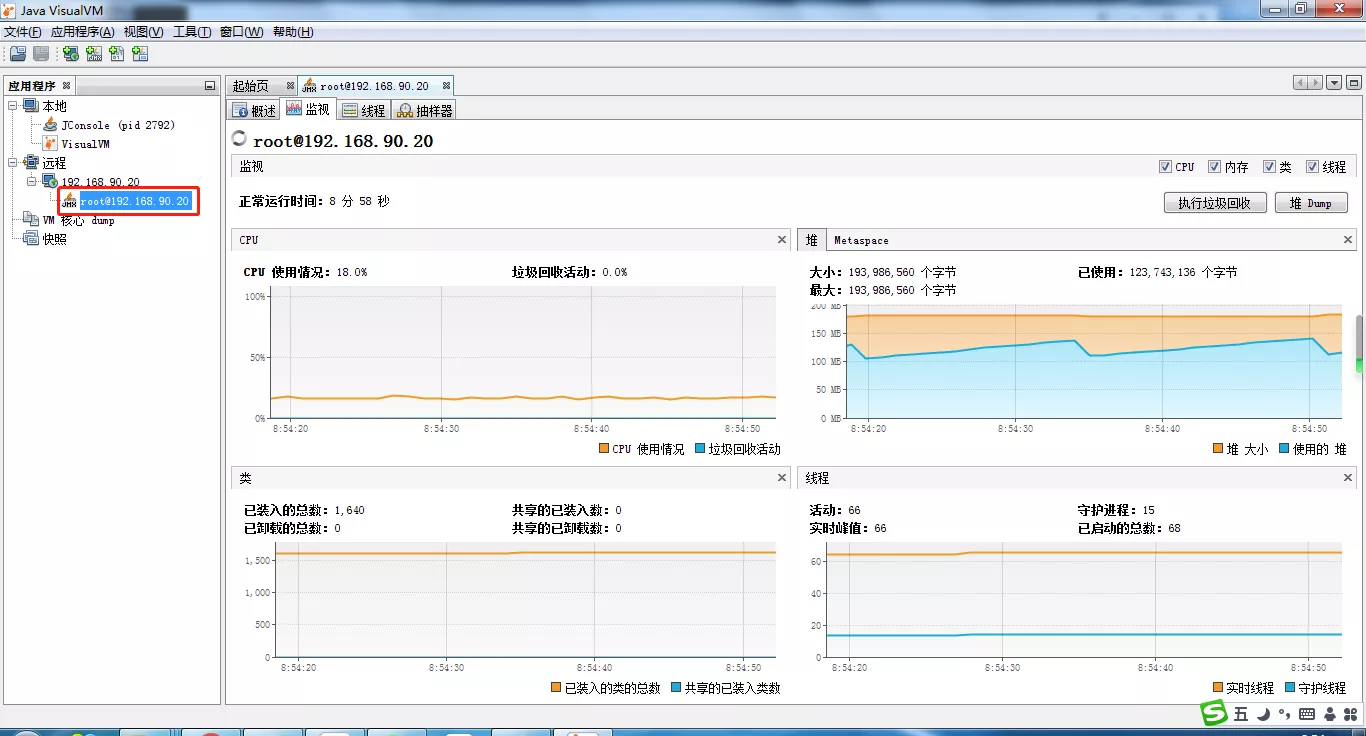
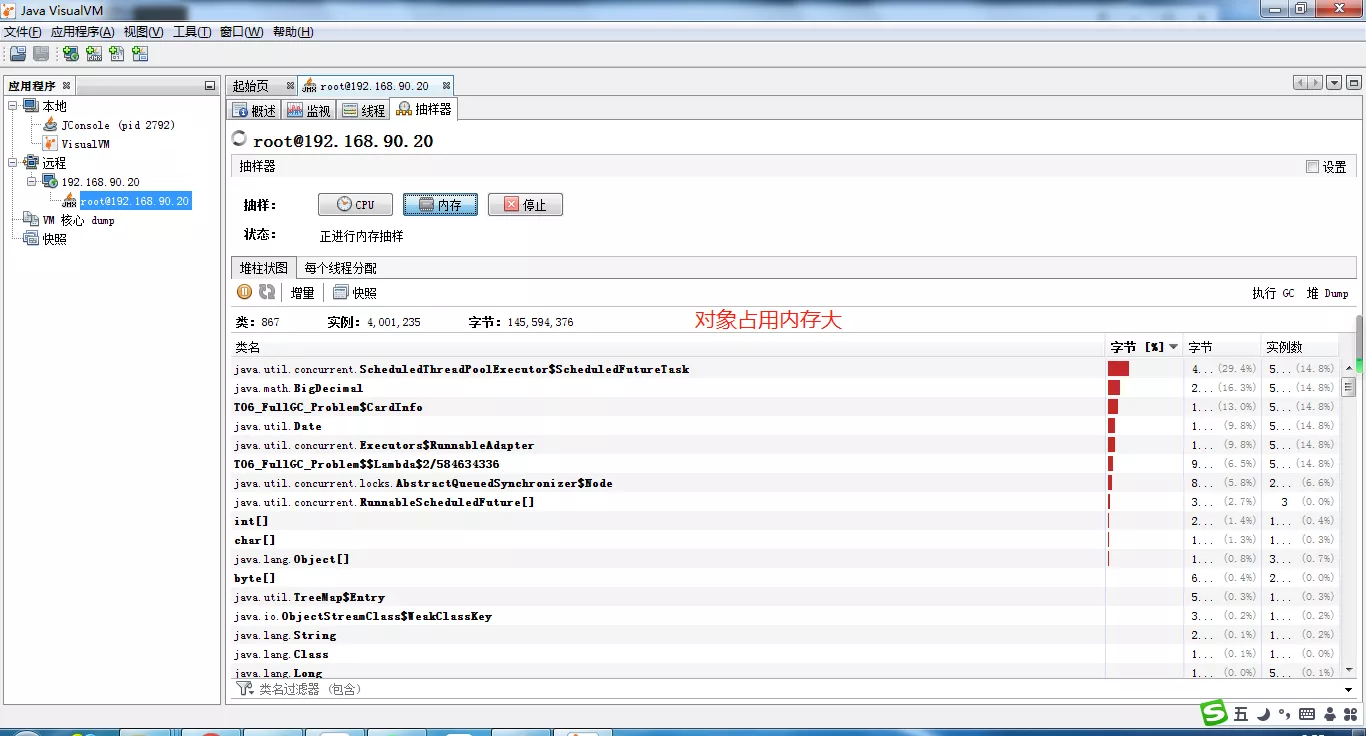
2. JvisualVM
使用jvisualvm的jstatd方式远程监控Java程序
3. Jprofiler(收费)
4. arthas
在线排查工具
为什么需要在线排查?在生产上经常会碰到一些不好排查的问题
- 线程安全问题
- threaddump或者heapdump不好查到问题原因
- 为了排查这些问题,有时会临时加一些日志
- eg:在一些关键的函数里打印出入参,然后重新打包发布,如果打了日志还是没找到问题,继续加日志,重新打包发布。对于上线流程复杂而且审核比较严的公司,从改代码到上线需要层层的流转,会大大影响问题排查的进度
java -Xms40M -Xmx40M -XX:+UseParallelGC -XX:+HeapDumpOnOutOfMemoryError T06_FullGC_Problem
1. 安装运行
-rw-r--r--. 1 root root     4514 4月  27 13:52 math-game.jar
[root@bogon arthas-bin]# java -jar arthas-boot.jar
[INFO] JAVA_HOME: /root/soft/jdk/jdk1.8.0_11/jre
[INFO] arthas-boot version: 3.6.8
[INFO] Found existing java process, please choose one and input the serial number of the process, eg : 1. Then hit ENTER.
* [1]: 23713 ../target/listao-gateway-server-1.11.0-SNAPSHOT.jar
  [2]: 14262 ./target/listao-boon-server-1.0.1-RELEASE.jar
  [3]: 13753 /home/alserver/develop/service_new/1.nacos-v2.2.0.1/target/nacos-server.jar
  [4]: 18347 T06_FullGC_Problem # 挂载到一个java进程上
4
[INFO] arthas home: /root/tmp/arthas-bin
[INFO] The target process already listen port 3658, skip attach.
[INFO] arthas-client connect 127.0.0.1 3658
  ,---.  ,------. ,--------.,--.  ,--.  ,---.   ,---.
 /  O  \ |  .--. ''--.  .--'|  '--'  | /  O  \ '   .-'
|  .-.  ||  '--'.'   |  |   |  .--.  ||  .-.  |`.  `-.
|  | |  ||  |\  \    |  |   |  |  |  ||  | |  |.-'    |
`--' `--'`--' '--'   `--'   `--'  `--'`--' `--'`-----'

wiki       https://arthas.aliyun.com/doc
tutorials  https://arthas.aliyun.com/doc/arthas-tutorials.html
version    3.6.8
main_class
pid        18347
time       2023-04-27 14:06:45

[arthas@18347]$
2. help
[arthas@18347]$ help
 NAME         DESCRIPTION
 help         Display Arthas Help
 auth         Authenticates the current session
 keymap       Display all the available keymap for the specified connection.
 sc           Search all the classes loaded by JVM
 sm           Search the method of classes loaded by JVM
 classloader  Show classloader info
 jad          Decompile class
 getstatic    Show the static field of a class
 monitor      Monitor method execution statistics, e.g. total/success/failure count, average rt, fail rate, etc.
 stack        Display the stack trace for the specified class and method
 thread       Display thread info, thread stack
 trace        Trace the execution time of specified method invocation.
 watch        Display the input/output parameter, return object, and thrown exception of specified method invocation
 tt           Time Tunnel
 jvm          Display the target JVM information
 memory       Display jvm memory info.
 perfcounter  Display the perf counter information.
 ognl         Execute ognl expression.
 mc           Memory compiler, compiles java files into bytecode and class files in memory.
 redefine     Redefine classes. @see Instrumentation#redefineClasses(ClassDefinition...)
 retransform  Retransform classes. @see Instrumentation#retransformClasses(Class...)
 dashboard    Overview of target jvm's thread, memory, gc, vm, tomcat info.
 dump         Dump class byte array from JVM
 heapdump     Heap dump
 options      View and change various Arthas options
 cls          Clear the screen
 reset        Reset all the enhanced classes
 version      Display Arthas version
 session      Display current session information
 sysprop      Display and change the system properties.
 sysenv       Display the system env.
 vmoption     Display, and update the vm diagnostic options.
 logger       Print logger info, and update the logger level
 history      Display command history
 cat          Concatenate and print files
 base64       Encode and decode using Base64 representation
 echo         write arguments to the standard output
 pwd          Return working directory name
 mbean        Display the mbean information
 grep         grep command for pipes.
 tee          tee command for pipes.
 profiler     Async Profiler. https://github.com/jvm-profiling-tools/async-profiler
 vmtool       jvm tool
 stop         Stop/Shutdown Arthas server and exit the console.
3. jvm
观察JVM信息,相当于jinfo
[arthas@20002]$ jvm
 RUNTIME
-----------------------------------------------------------------------------------------------------------
 MACHINE-NAME                                                       20002@bogon
 JVM-START-TIME                                                     2023-04-27 14:33:19
 MANAGEMENT-SPEC-VERSION                                            1.2
 SPEC-NAME                                                          Java Virtual Machine Specification
 SPEC-VENDOR                                                        Oracle Corporation
 SPEC-VERSION                                                       1.8
 VM-NAME                                                            Java HotSpot(TM) 64-Bit Server VM
 VM-VENDOR                                                          Oracle Corporation
 VM-VERSION                                                         25.11-b03
 INPUT-ARGUMENTS                                                    -Xms40M
                                                                    -Xmx40M
                                                                    -XX:+UseParallelGC
                                                                    -XX:+HeapDumpOnOutOfMemoryError

 CLASS-PATH            .:/usr/local/jdk/jre/lib/rt.jar:/usr/local/jdk/lib/dt.jar:/usr/local/jdk/lib/tools.jar
 BOOT-CLASS-PATH       /root/soft/jdk/jdk1.8.0_11/jre/lib/rt.jar:/root/soft/jdk/jdk1.8.0_11/jre/lib/sunrsasign.jar:/root/soft/jdk/jdk1.8.0_11/jre/lib/jsse.jar:/root/soft/jdk/jdk1.8.0_11/jre/lib/jce.jar:/root/soft/jdk/jdk1.8.0_11/jre/lib/charsets.jar:/root/soft/jdk/jdk1.8.0_11/jre/lib/jfr.jar:/root/soft/jdk/jdk1.8.0_11/jre/classes

 LIBRARY-PATH          /usr/java/packages/lib/amd64:/usr/lib64:/lib64:/lib:/usr/lib

-----------------------------------------------------------------------------------------------------------
 CLASS-LOADING
-----------------------------------------------------------------------------------------------------------
 LOADED-CLASS-COUNT                                                 3132
 TOTAL-LOADED-CLASS-COUNT                                           3132
 UNLOADED-CLASS-COUNT                                               0
 IS-VERBOSE                                                         false

-----------------------------------------------------------------------------------------------------------
 COMPILATION
-----------------------------------------------------------------------------------------------------------
 NAME                                                               HotSpot 64-Bit Tiered Compilers
 TOTAL-COMPILE-TIME                                                 716
 [time (ms)]

-----------------------------------------------------------------------------------------------------------
 GARBAGE-COLLECTORS
-----------------------------------------------------------------------------------------------------------
 PS Scavenge                                                        name : PS Scavenge
 [count/time (ms)]                                                  collectionCount : 11
                                                                    collectionTime : 24
 PS MarkSweep                                                       name : PS MarkSweep
 [count/time (ms)]                                                  collectionCount : 0
                                                                    collectionTime : 0

-----------------------------------------------------------------------------------------------------------
 MEMORY-MANAGERS
-----------------------------------------------------------------------------------------------------------
 CodeCacheManager                                                   Code Cache
 Metaspace Manager                                                  Metaspace
                                                                    Compressed Class Space
 PS Scavenge                                                        PS Eden Space
                                                                    PS Survivor Space
 PS MarkSweep                                                       PS Eden Space
                                                                    PS Survivor Space
                                                                    PS Old Gen

-----------------------------------------------------------------------------------------------------------
 MEMORY
-----------------------------------------------------------------------------------------------------------
 HEAP-MEMORY-USAGE                                                  init : 41943040(40.0 MiB)
 [memory in bytes]                                                  used : 22417400(21.4 MiB)
                                                                    committed : 37748736(36.0 MiB)
                                                                    max : 37748736(36.0 MiB)
 NO-HEAP-MEMORY-USAGE                                               init : 2555904(2.4 MiB)
 [memory in bytes]                                                  used : 24548624(23.4 MiB)
                                                                    committed : 25296896(24.1 MiB)
                                                                    max : -1(-1 B)
 PENDING-FINALIZE-COUNT                                             0

-----------------------------------------------------------------------------------------------------------
 OPERATING-SYSTEM
-----------------------------------------------------------------------------------------------------------
 OS                                                                 Linux
 ARCH                                                               amd64
 PROCESSORS-COUNT                                                   4
 LOAD-AVERAGE                                                       0.1
 VERSION                                                            3.10.0-957.el7.x86_64

-----------------------------------------------------------------------------------------------------------
 THREAD
-----------------------------------------------------------------------------------------------------------
 COUNT                                                              64
 DAEMON-COUNT                                                       13
 PEAK-COUNT                                                         64
 STARTED-COUNT                                                      65
 DEADLOCK-COUNT                                                     0

-----------------------------------------------------------------------------------------------------------
 FILE-DESCRIPTOR
-----------------------------------------------------------------------------------------------------------
 MAX-FILE-DESCRIPTOR-COUNT                                          4096
 OPEN-FILE-DESCRIPTOR-COUNT                                         104
4. thread
定位线程问题。查看线程信息
[arthas@20002]$ thread
Threads Total: 74, NEW: 0, RUNNABLE: 8, BLOCKED: 0, WAITING: 54, TIMED_WAITING: 2, TERMINATED: 0, Internal threads: 10
ID     NAME                           GROUP   PRIORITY  STATE     %CPU   DELTA_TIME  TIME      INTERRUPTED  DAEMON
-1     GC task thread#3 (ParallelGC)  -       -1        -         28.97  0.076       6:59.039  false        true
-1     GC task thread#1 (ParallelGC)  -       -1        -         28.08  0.074       6:59.826  false        true
-1     GC task thread#2 (ParallelGC)  -       -1        -         27.9   0.073       6:59.505  false        true
-1     GC task thread#0 (ParallelGC)  -       -1        -         27.82  0.073       6:59.633  false        true
-1     VM Thread                      -       -1        -         4.13   0.010       1:17.370  false        true
70     arthas-command-execute         system  5         RUNNABLE  0.35   0.000       0:0.030   false        true
1307   pool-1-thread-1308             main    5         WAITING   0.27   0.000       0:1.930   false        false
1309   pool-1-thread-1310             main    5         WAITING   0.26   0.000       0:1.880   false        false
1253   pool-1-thread-1254             main    5         WAITING   0.25   0.000       0:1.906   false        false
1239   pool-1-thread-1240             main    5         WAITING   0.23   0.000       0:1.943   false        false
# ...
# 查看具体的thread详细信息
[arthas@20002]$ thread 70
"arthas-command-execute" Id=70 RUNNABLE
    at sun.management.ThreadImpl.dumpThreads0(Native Method)
    at sun.management.ThreadImpl.getThreadInfo(ThreadImpl.java:440)
    at com.taobao.arthas.core.command.monitor200.ThreadCommand.processThread(ThreadCommand.java:233)
    at com.taobao.arthas.core.command.monitor200.ThreadCommand.process(ThreadCommand.java:120)
    at com.taobao.arthas.core.shell.command.impl.AnnotatedCommandImpl.process(AnnotatedCommandImpl.java:82)
    at com.taobao.arthas.core.shell.command.impl.AnnotatedCommandImpl.access$100(AnnotatedCommandImpl.java:18)
    at com.taobao.arthas.core.shell.command.impl.AnnotatedCommandImpl$ProcessHandler.handle(AnnotatedCommandImpl.java:111)
    at com.taobao.arthas.core.shell.command.impl.AnnotatedCommandImpl$ProcessHandler.handle(AnnotatedCommandImpl.java:108)
    at com.taobao.arthas.core.shell.system.impl.ProcessImpl$CommandProcessTask.run(ProcessImpl.java:385)
    at java.util.concurrent.Executors$RunnableAdapter.call(Executors.java:511)
    at java.util.concurrent.FutureTask.run(FutureTask.java:266)
    at java.util.concurrent.ScheduledThreadPoolExecutor$ScheduledFutureTask.access$201(ScheduledThreadPoolExecutor.java:180)
    at java.util.concurrent.ScheduledThreadPoolExecutor$ScheduledFutureTask.run(ScheduledThreadPoolExecutor.java:293)
    at java.util.concurrent.ThreadPoolExecutor.runWorker(ThreadPoolExecutor.java:1142)
    at java.util.concurrent.ThreadPoolExecutor$Worker.run(ThreadPoolExecutor.java:617)
    at java.lang.Thread.run(Thread.java:745)
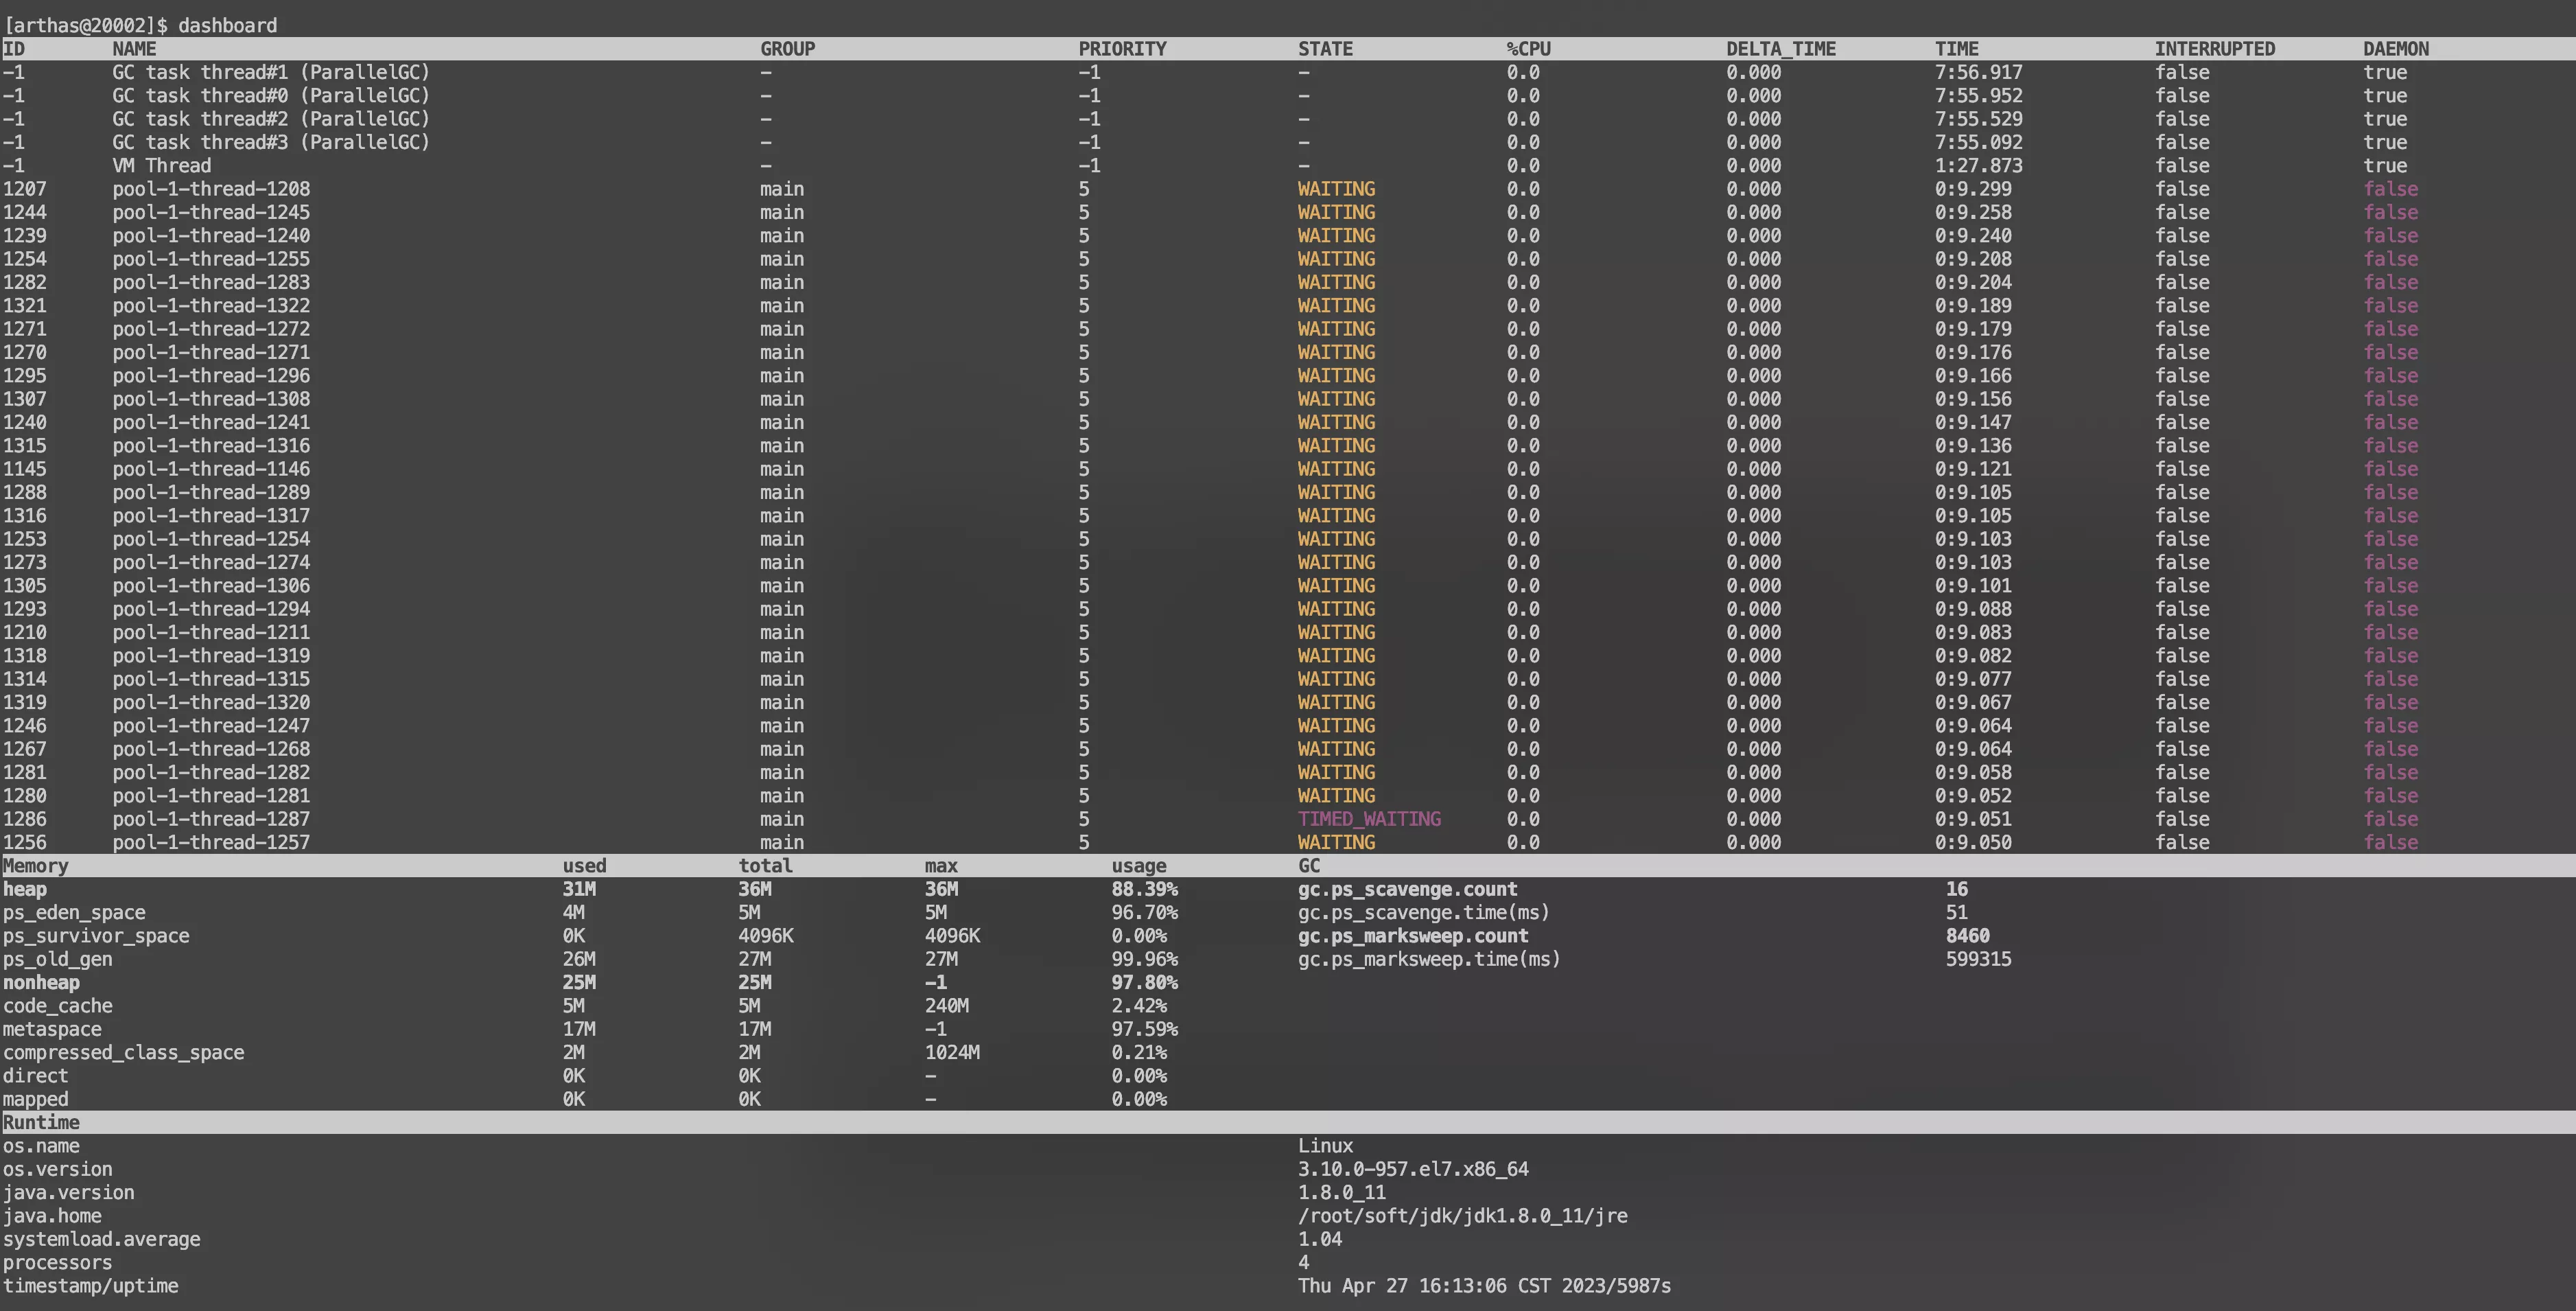
5. dashboard
观察系统情况。dashboard类似top命令
6. heapdump
尽量不要堆转储
[arthas@20002]$ heapdump
Dumping heap to /tmp/heapdump2023-04-27-16-154676539714674020039.hprof ...
Heap dump file created
[arthas@20002]$ heapdump /Users/listao/Downloads/4-27/20230427.hprof
Dumping heap to /root/tmp/20230427.hprof ...
Heap dump file created
7. jad反编译
[arthas@1422]$ jad T06_FullGC_Problem

ClassLoader:
+-sun.misc.Launcher$AppClassLoader@2a139a55
  +-sun.misc.Launcher$ExtClassLoader@9f47bbe

Location:
/Users/list/Downloads/4-27/tmp/

Affect(row-cnt:0) cost in 1587 ms.
jad: fail to decompile class: T06_FullGC_Problem, please check $HOME/logs/arthas/arthas.log for more details.
- 动态代理生成类的问题定位
- 第三方的类(观察代码)
- 版本问题(确定自己最新提交的版本是不是被使用)
8. redefine热替换
目前有些限制条件:只能改方法实现(方法已经运行完成),不能改方法名,不能改属性 m() -> mm()
public class T {
    public static void main(String[] args) throws Exception {
        for (; ; ) {
            System.in.read();
            new TT().m();
        }
    }
}
public class TT {
    public void m() {
        System.out.println(1);
    }
}
javac *.java
java T
[arthas@86716]$ jad TT

ClassLoader:
+-sun.misc.Launcher$AppClassLoader@73d16e93
  +-sun.misc.Launcher$ExtClassLoader@418cc198

Location:
/root/tmp/hot/

       public class TT {
           public void m() {
               System.out.println(1); # => 将这个改为2
           }
       }

Affect(row-cnt:1) cost in 680 ms.

# 2. 热部署
[arthas@86716]$ redefine /root/tmp/hot/TT.class
redefine success, size: 1, classes:
TT
# 1. 重新编辑,编译
[root@localhost hot]# vim TT.java
[root@localhost hot]# javac TT.java
9. sc
search class
10. watch
watch method
11. 没有jmap功能
6. dump
1. create
1. on_hook
JVM挂机,会自动产生Heap的信息文件
-XX:+HeapDumpOnOutOfMemoryError
2. arthas
3. jmap
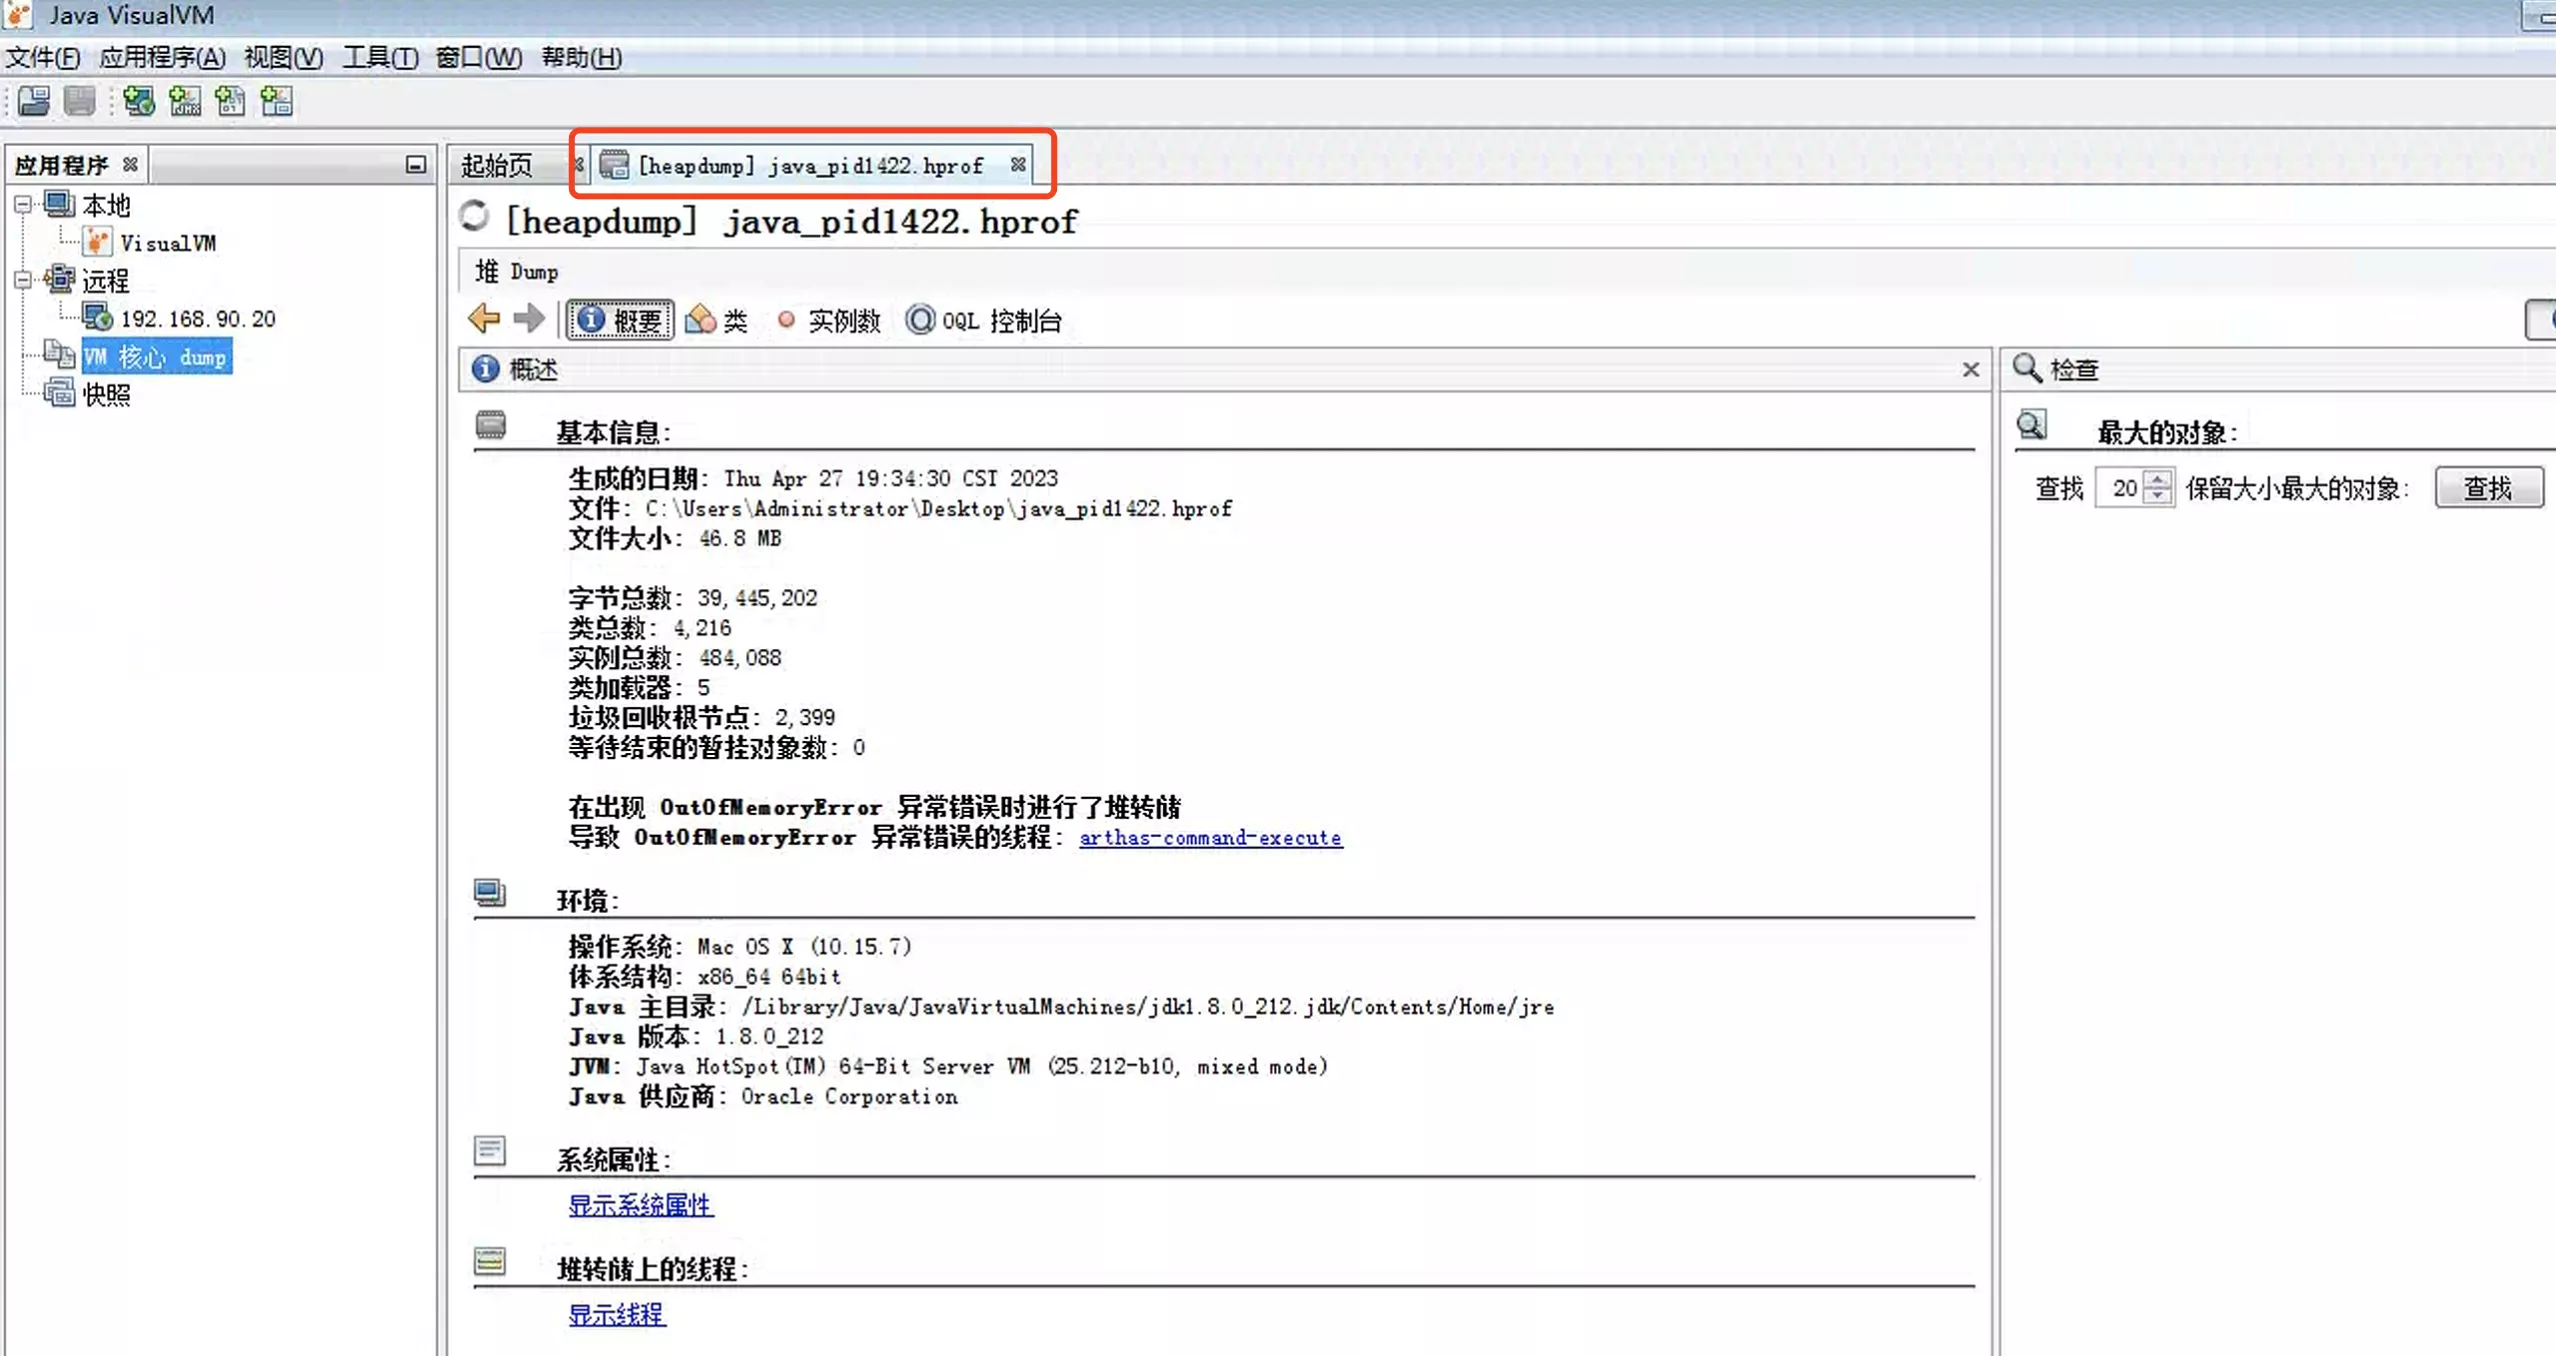
2. analysis
1. jhat
- hrpof太大会OOM
- 7000
- java命令--jhat命令使用
jhat -J-mx512M xxx.hrpof
[root@localhost tmp]# jhat -J-mx512M java_pid1422.hprof
Reading from java_pid1422.hprof...
Dump file created Thu Apr 27 19:34:30 CST 2023
Snapshot read, resolving...
Resolving 488312 objects...
WARNING: Failed to resolve object id 0x7bd97b330 for field pkcs8KeySpecClass (signature L)
WARNING: Failed to resolve object id 0x7bd97b398 for field rsaPrivateCrtKeySpecClass (signature L)
# ...
WARNING: Failed to resolve object id 0x7bf784d40 for field type (signature L)
WARNING: Failed to resolve object id 0x7bf7cod807a0 for field value (signature L)
WARNING: Failed to resolve object id 0x7bf780708 for field value (signature L)
Chasing references, expect 97 dots.................................................................................................
Eliminating duplicate references..................................................................................
Snapshot resolved.
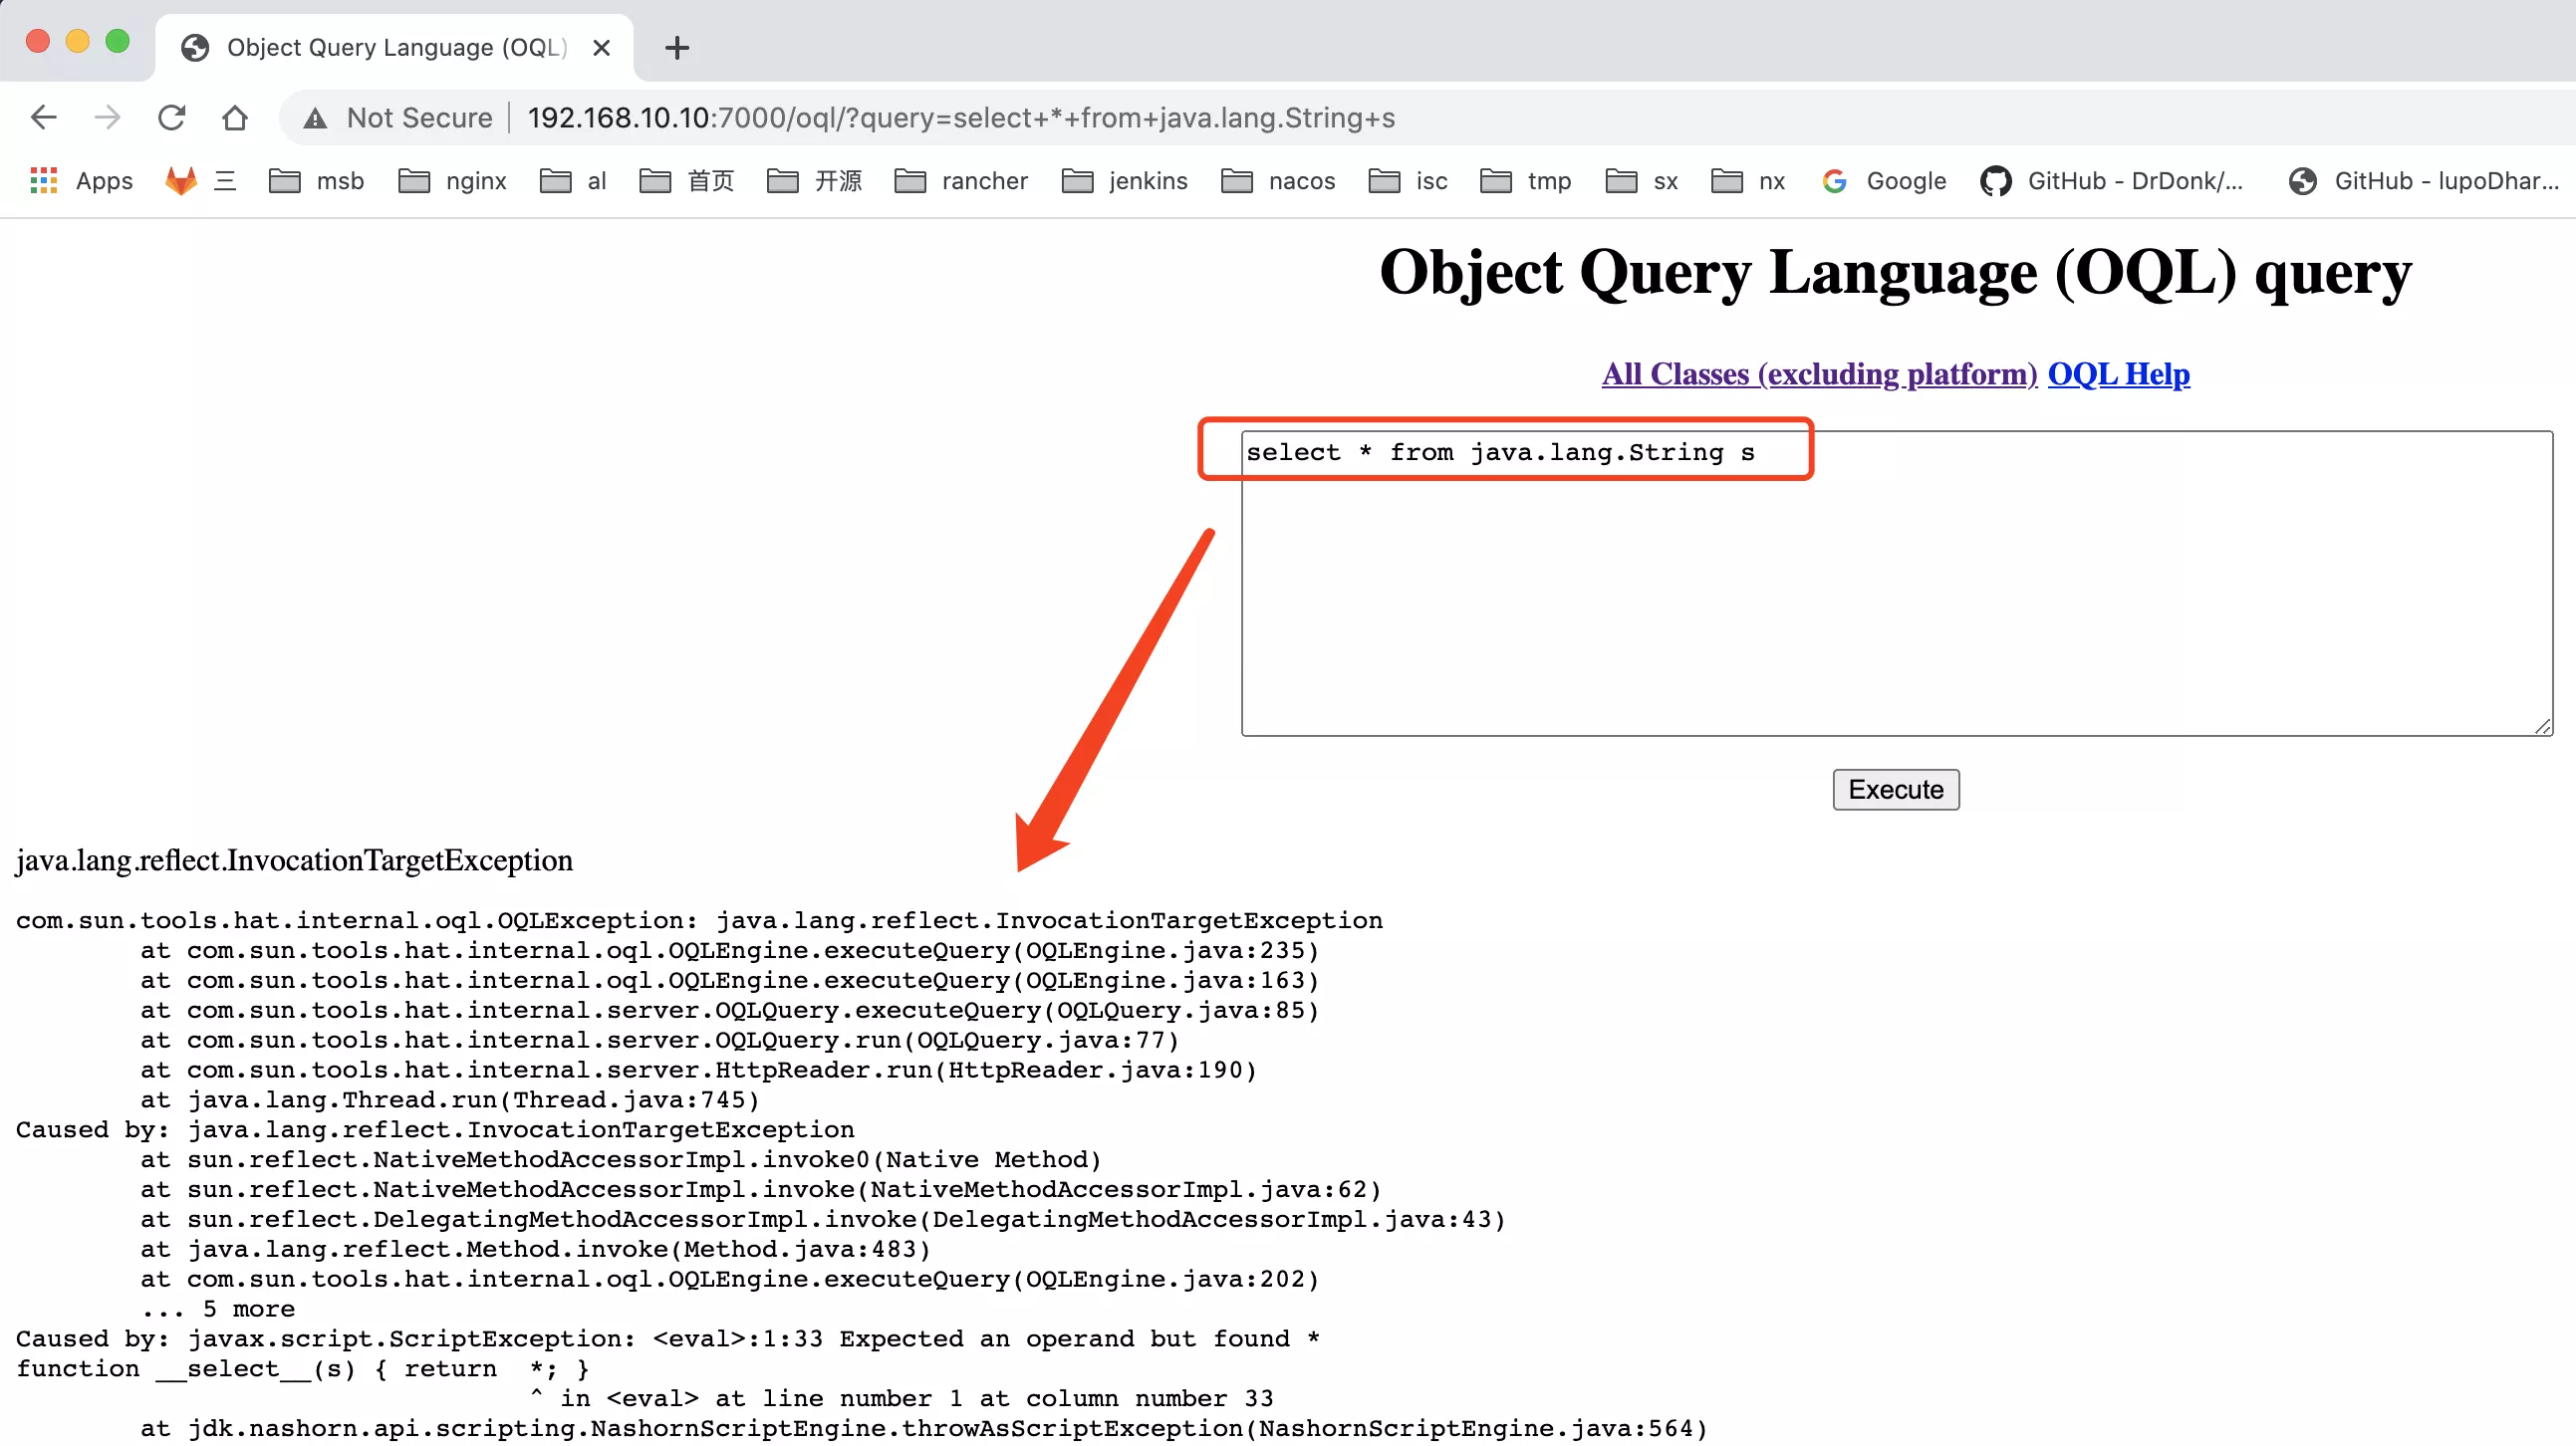
Started HTTP server on port 7000 # 端口 => http://192.168.10.10:7000/
Server is ready.
拉到最后:找到对应链接
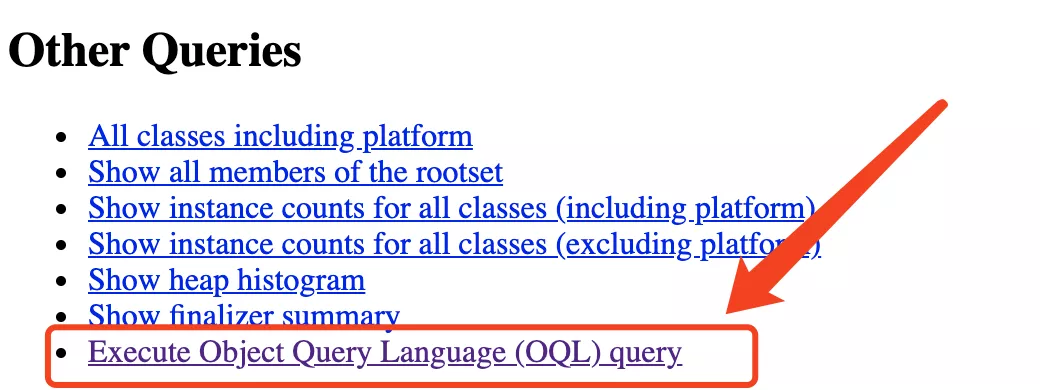
可以使用OQL查找特定问题对象,找到代码的问题
2. JVisualVM